Market

July 23, 2024
Flatbed rates hold steady amid economic fluctuation
Written by Robert Martin
With Q2 in the books, we find ourselves in a similar position to where we started the year. Flatbed rates have remained stable for the duration of the year, moving between $2.47/mile and $2.53/mile, inclusive of fuel at a national level. While January brought challenges from winter storms and spring brought seasonal volatility to certain markets, overall, the marketplace has remained relatively calm. Shippers are still enjoying favorable conditions with plenty of supply to meet shipping demand.
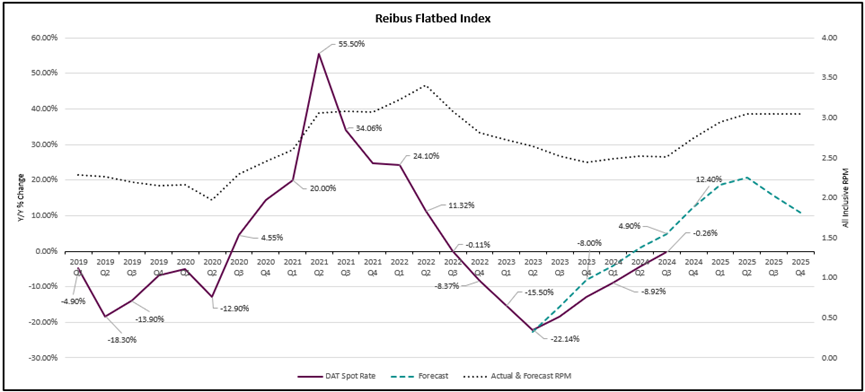
Our flatbed spot rate index closed Q2 at a mark of -4.29% y/y, putting us ~5% off our original forecast of +1%. After eight long quarters of deflationary rates, it appears carriers will have to wait at least another month or two for positive rate action on a y/y basis. Our first read of Q3 appears to be pointing towards reaching the light at the end of the tunnel for spot-dependent carriers. After the first few weeks of July, our initial spot index read for Q3 shows rates back on the positive side, albeit just barely, at +.26% y/y. Yes, that comes out to a whole one cent per mile higher than Q3 2023!
So what comes next? Flatbed spot rates are still down 26% from their Q2 2022 peak. Have we found a bottom? Could rates go lower? Given historical tried and true market fundamentals remain unchanged, it is unlikely rates can turn much lower absent a substantial economic downturn. Based on consumer consumption, industrial production, and recent inflation data, the economy appears to be on firm ground so, thankfully, it is unlikely we see a major drop in demand at this point.
What would it take for flatbed rates to increase markedly? In economic terms, demand would need to outstrip supply – or to put it in plain English, shippers would need to ship more freight than carriers have trucks available. Thus, the bidding war for capacity would ensue, as it has so many times before.
I’ve hinted at the macro picture, so let’s quickly review it here. The macroeconomic picture remains a bit tepid but leans mostly constructive. Consumption for Q1 was revised slightly lower to +2.3% y/y vs. +2.4%. And beneath the headline number, we saw another downward revision for Q1 durable goods consumption – +1.3% y/y vs. +2.0% previously and +5.8% in Q4 2023. These revisions point to a perhaps weaker economy than headlines may have alluded to in the first half of the year. If the trajectory holds over the next couple quarters, we expect any meaningful recovery in industrial activity to struggle with regard to timing and magnitude. On a more positive note, we did see a +0.9% sequential improvement in industrial production in May, taking the revised Q2 read to just barely inflationary at +0.1% y/y. Service center inventories remain elevated on a y/y basis, currently holding 61 days’ worth of inventory vs. 53 days this time last year.
Even without a substantial uptick in demand, it is possible enough supply exits the marketplace to again put upward pressure on rates. Carrier pay has not increased over the past two years, but we are all aware inflation has driven carriers’ costs up. From insurance to maintenance and equipment costs to driver pay, carriers are shelling out more and more to keep their trucks on the road each year. Bottom lines have been squeezed over the past two years and carriers will naturally pull capacity offline and/or exit the marketplace as profit falls or even potentially turns negative.
How do things differ in the dry van market? Our dry van spot index closed Q2 at -2.88% y/y vs. +2.5% as originally forecasted. So just like flatbed, we are ~5% off our forecast. Like flatbed, our initial Q3 read of +1.45% y/y puts us back on the inflationary side of the rate spectrum for the first time since Q2 2022. Dry van spot rates are traditionally more volatile than flatbed but have moved along similar paths over the previous eight quarters and have moved within a similarly small range as flatbed this year – operating between $1.99-$2.10/mile. Current dry van spot rates are down 32% against their peak in Q1 2022 but have rallied 5% off of their April lows. The market has not felt it yet, but dry van rates have risen sharply in the past couple months. It remains to be seen if this was just a blip driven by peak summer shipping or if this rally will have staying power post-4th of July.
Looking ahead, we’ll keep a close watch on the market’s twists and turns. There’s hope on the horizon, but it’s clear we need to stay quick on our feet and ready to adapt as we respond to these unpredictable times.
Editor’s note: The views, thoughts, and opinions expressed in the content above belong solely to the author and do not necessarily reflect the opinions and beliefs of Recycled Metals Update or its parent company, CRU Group.