
Market

December 10, 2015
Ferrous Scrap Exports through October Down 15.6% YOY
Written by Peter Wright
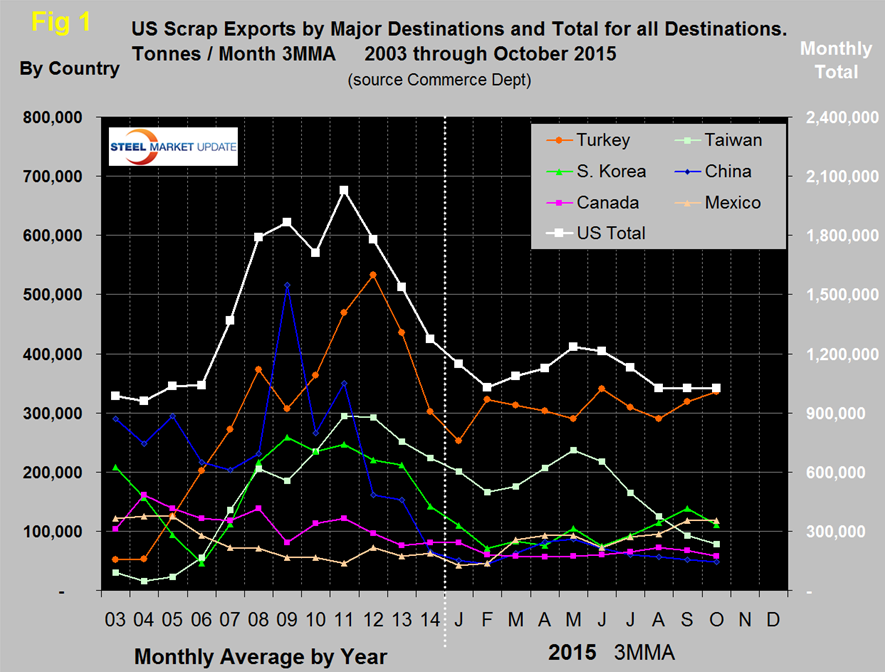
In the first ten months of this year bulk scrap exports were 10,889,000 tonnes for an annual rate of 14,519,000 tonnes, down by 15.6 percent from the first ten months of last year. The tonnages shown in Figure 1 are based on three month moving averages (3MMA) for 2015 and on the annual monthly average for previous years.
The graph shows that exports declined for three consecutive years, 2012 through 2014, continuing through January and February this year. March saw a trend reversal that continued through May followed by three months of decline. The August, September and October tonnages were almost exactly the same on a 3MMA basis. In the twelve months of 2014, scrap exports totaled 15,308,000 tonnes, down by 17.1 percent from the same period in 2013.
In the single month of October, Turkey was the major destination with 257,000 tonnes, followed by India with 185,000 tonnes and Mexico with 131,000, tonnes. September had the highest monthly tonnage into Turkey since December 2013 but October returned to the recent norm. The tonnage into India was the highest since August 2011. Turkey has been the major destination in nine out of ten months this year but by all accounts the purchase of scrap by Turkish mills is being reduced by semi-finished purchases from China in particular but also from Russia and Ukraine. The latest export data available is for October, and since October 28th through December 2nd, the East Coast US export scrap has picked back up by $26.75 to $183.75. Semi-finished imports will continue to be favored by Turkish mills until the decline in scrap prices upsets that balance. In the first ten months of this year the global price of iron ore gave the integrated producers in China a cost advantage over the electric furnace steelmakers in Turkey. On December 4th iron ore broke through $40 heading down and reached $39.40/dmt. The long term average ratio between the price of scrap and ore is a multiple of 3.3, the latest price moves brought that ratio to 4.1 which continues to be advantageous to the integrated producers.
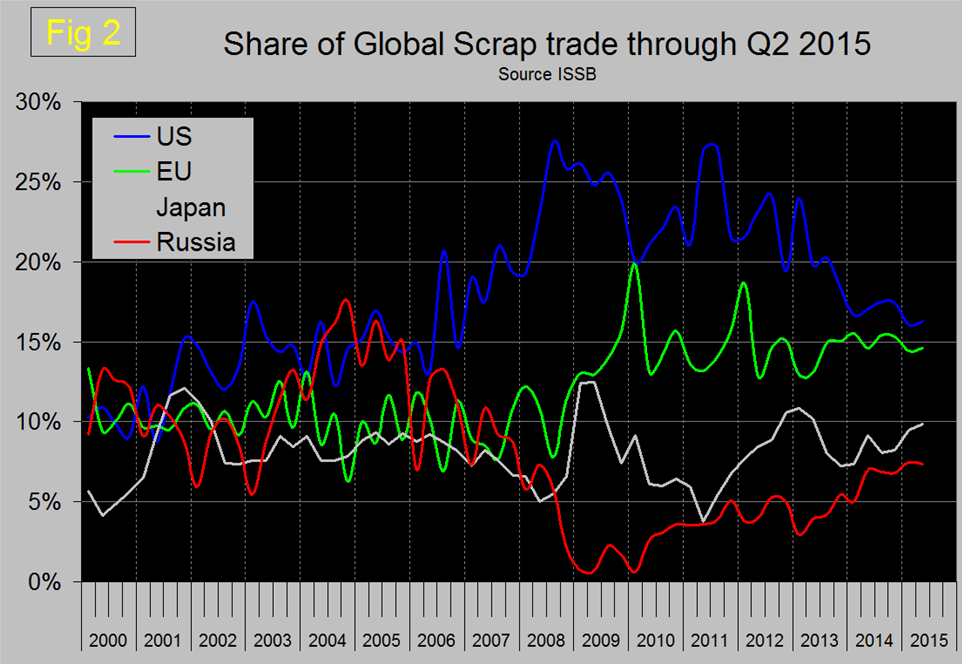
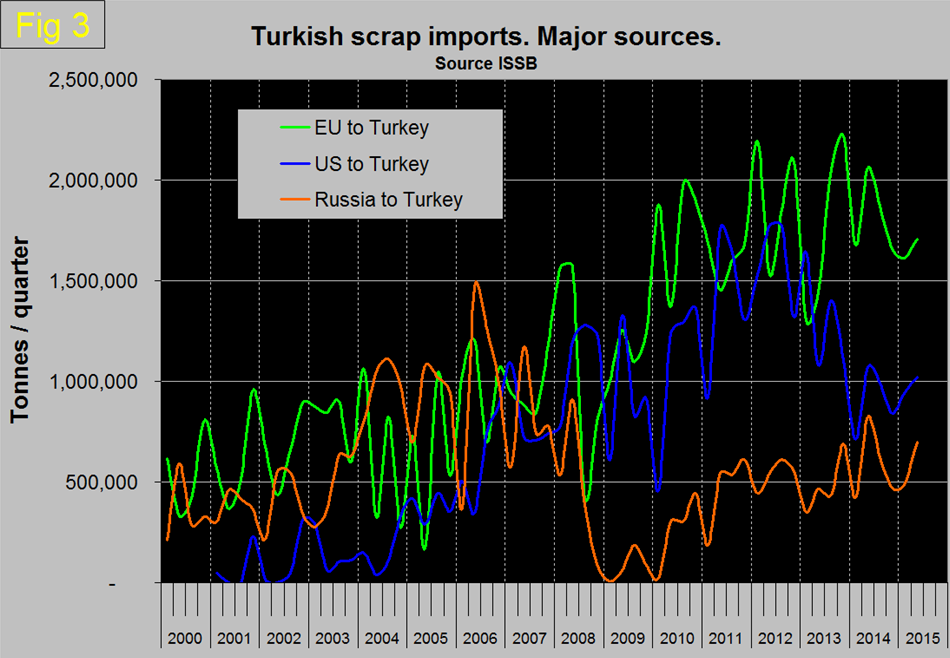
We published Figure 2 and Figure 3 in each of our last two months reports and have left them in here for context.
Global trade data for the 3rd quarter will be available shortly at which time we will update these graphs. The US share of global scrap trade has steadily declined since 2011 as the share of Russia and Japan has increased backed by their depreciated currencies. Russia has taken share from the US as a scrap source to Turkey.
US scrap exports to the Far East through the first ten months were down by 34.3 percent from last year as Japan picks up share in that region. YTD through October exports to Canada were down by 23.6 percent and to Mexico were up by 39.8 percent. India has become a big player this year and their tonnage out of the US has put them in 5th place as a destination, up by 98.1 percent YTD. Exports to South Korea and Taiwan were down by 36.1 percent and 32.3 percent respectively. Shipments to China YTD through October were 607,000 tonnes, down by 9.5 percent from last year.
Scrap export prices are reported by the AMM every Tuesday for an 80:20 mix of #1 and #2 heavy melt in US $ per tonne FOB New York and Los Angeles for bulk tonnage sales. Through November 11th the price on the East Coast had collapsed by $142.47 per gross ton year to date and by $115.50 on the West Coast. Since then, as mentioned above, the East Coast has recovered by $26.75 to $183.75, the West Coast is up by $17.5 to $179.50. Based on our benchmark comparisons between the price of scrap and the prices of iron ore and oil, we see no upward potential for the domestic price.
The post Ferrous Scrap Exports through October Down 15.6% YOY appeared first on Steel Market Update.


