
Market

December 21, 2017
Global Scrap Trade: China’s a Net Exporter!
Written by Peter Wright
Steel Market Update performs this analysis of global scrap trade each quarter to help readers understand the gyrations of the domestic scrap market and where the U.S. stands as a global player. This data is not very current because some nations are slow to report, but we still believe it gives a valuable perspective on global trends and is the foundation of where we are today. Most notable in the data is that China has become a net exporter of scrap, which has major implications for the global scrap market.
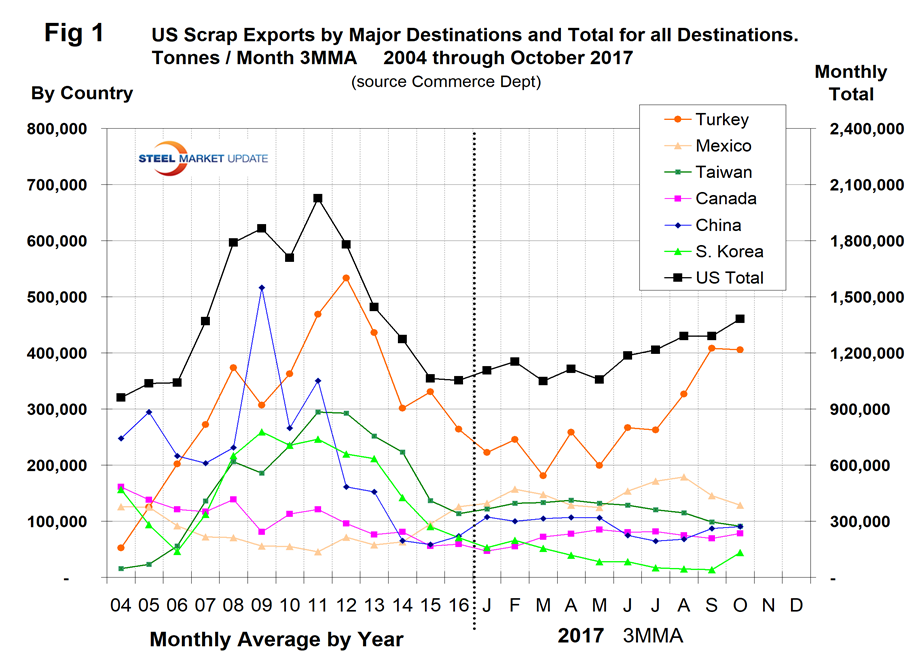
To set the scene, Figure 1 shows total scrap exports from the U.S. as reported by the U.S. Department of Commerce on the right axis together with the major destinations reported on the left axis. It shows the monthly average for the years 2004 through 2016 and the three-month moving average for January through October 2017. Year to date through October, U.S. scrap exports are up by 17.6 percent from the same period in 2016. The increase compared to 2015 is similar, and 2017 is approaching the rate for 2014. Exports are well down from the rate experienced in the years 2008 through 2013.
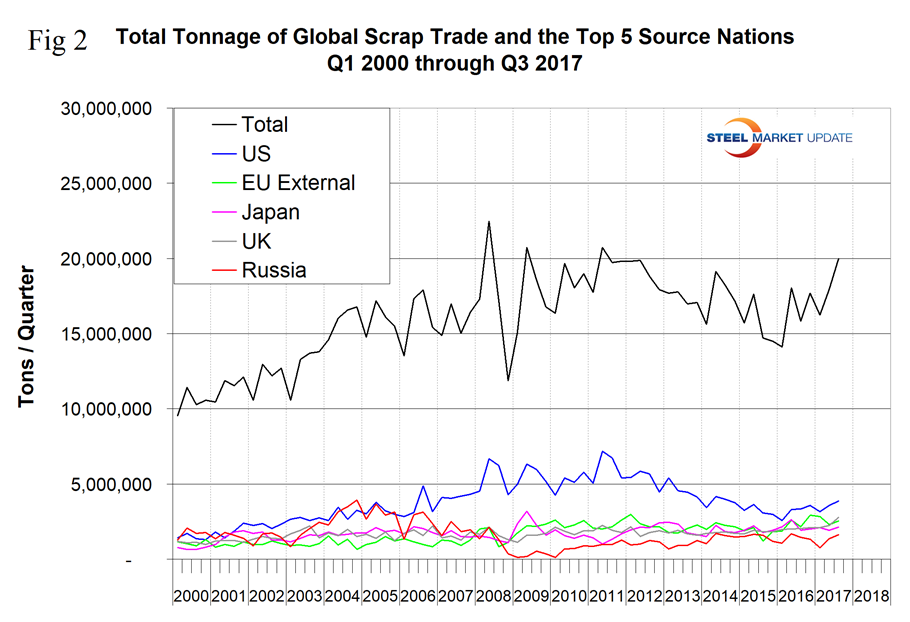
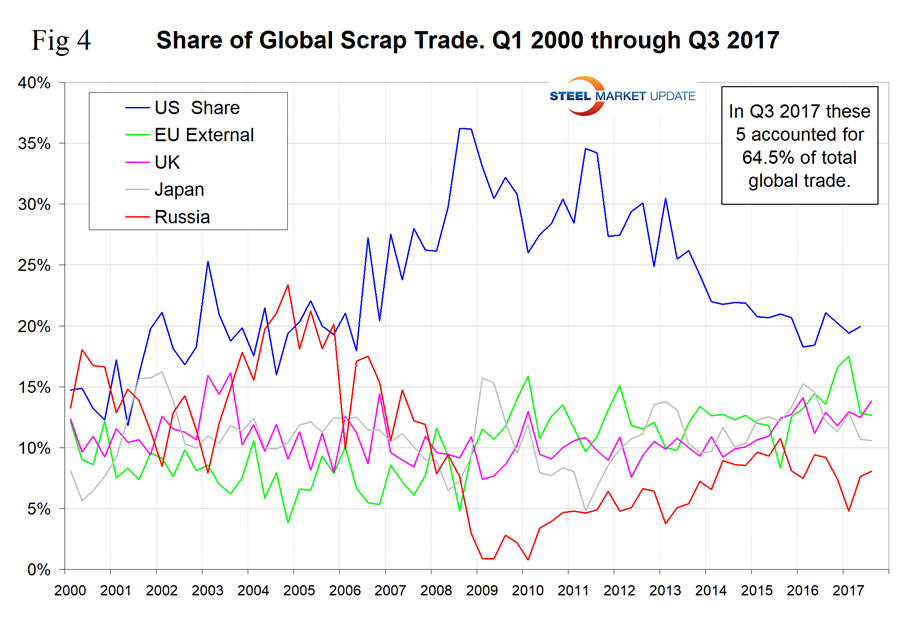
In our analysis of global scrap trade, we have excluded scrap that moved within the EU from the global total. Figure 2 shows the total tonnage of global trade since Q1 2000 and the volume of the top five suppliers. These five are the U.S., the EU, the UK, Japan and Russia, which accounted for 64.5 percent of the total in Q3 2017.
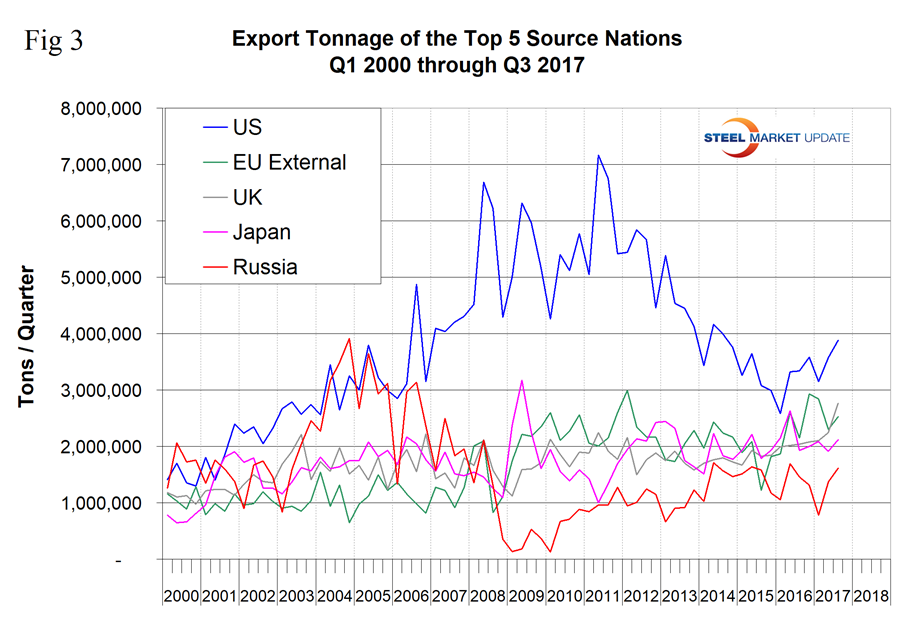
The total tonnage of ferrous scrap traded between nations in Q1 2016 was the lowest since the recession, but bounced back in the latest six quarters. We have witnessed a reversal of the declining trend that existed from Q2 2011 through Q1 2016. Figure 3 is the same graph with the total removed to better illustrate the volume of the five major players. The U.S. is still the highest volume source on a tonnage basis, but the EU has been closing the gap since Q3 2015.
Figure 4 shows the market share of the top five sources. The U.S. share peaked at 36.2 percent in the third and fourth quarters of 2008 and has declined to 19.4 percent in Q3 2017.
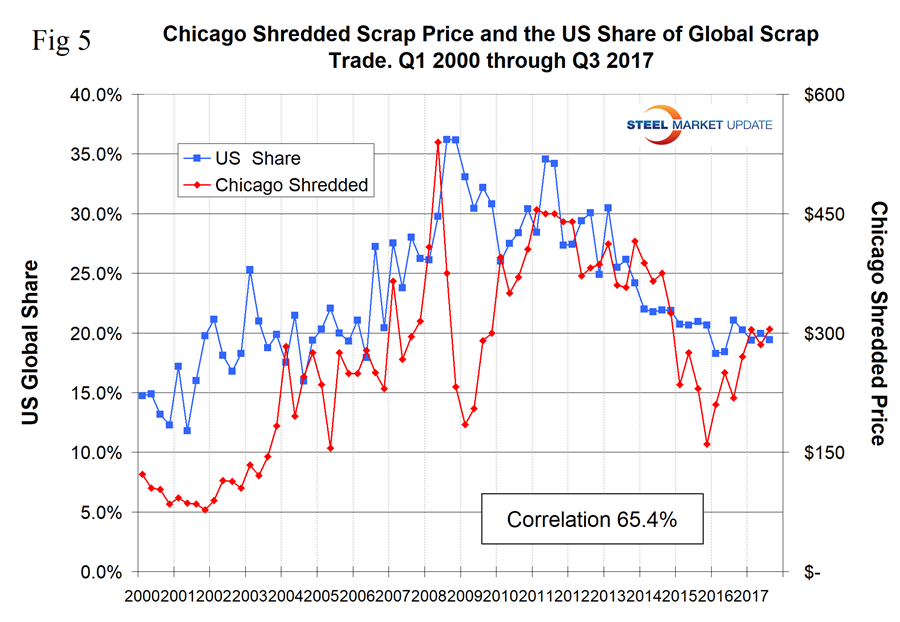
We attribute the long-term decline in the U.S. share to the strengthening of the U.S. dollar. The dollar strengthened from 2011 through Q4 2016. We can expect the weakening of the dollar in 2017 to lead to an increase in U.S. scrap exports in future quarters. The EU’s share increased to 17.5 percent in Q1 2017 and declined to 12.6 percent in the latest data. Interestingly, in Q3 scrap exports from the UK exceeded those from the European Union. There is somewhat of a relationship between the U.S. global share and the U.S. domestic scrap price. The result is shown in Figure 5 with a correlation of 65.4 percent. The fact that our export share increases as our domestic price increases might seem backwards at first glance. However, scrap is a global commodity, and this would seem to support the view that the domestic price is driven more by export volume than by domestic demand.
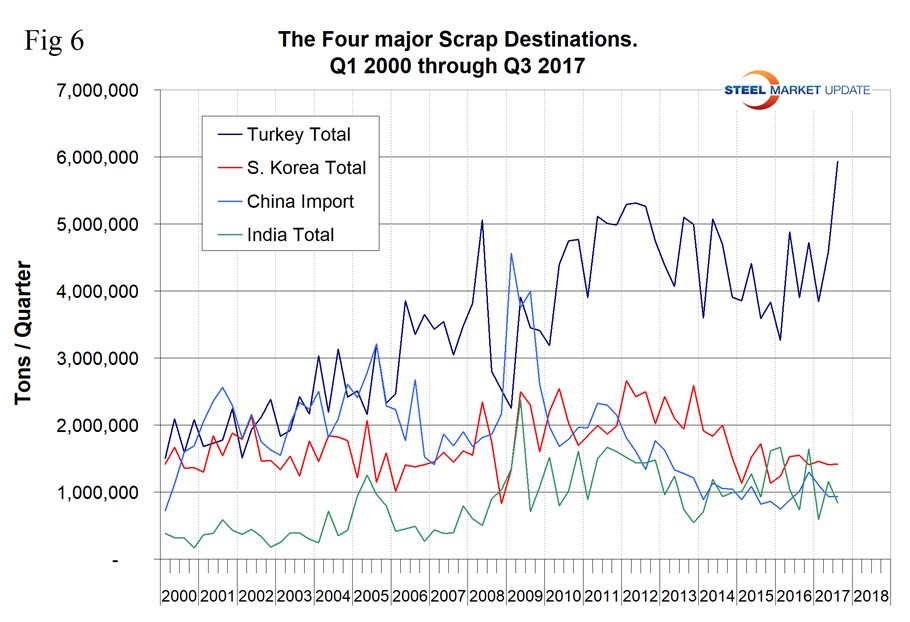
Figure 6 shows the tonnage received by the four major importing nations.
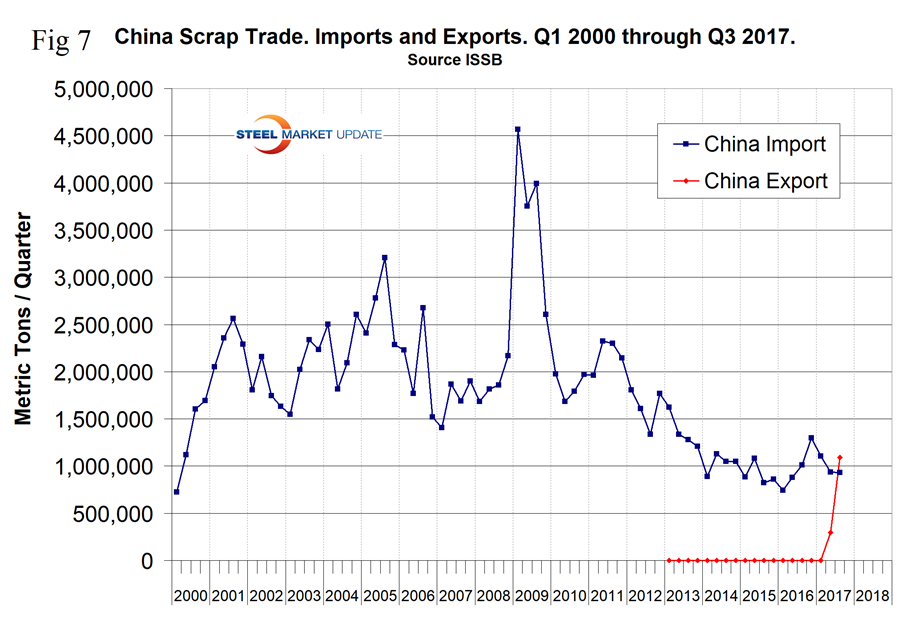
Turkey is by far the largest global scrap buyer with a tonnage more than the other three combined. Turkey’s import volume hit an all-time high in Q3 2017. China’s scrap imports have been fairly consistent in the last 3.5 years. The most significant information in this latest data is that China’s scrap exports have finally taken off and in Q3 2017 China’s exports exceeded its imports. Chinese scrap exports surged from virtually zero to 279,000 tons in Q2 and to 1,090,000 tons in Q3 (Figure 7). This is still a small volume, but we expect China to totally disrupt the global scrap market before the end of this decade as the massive consumption of steel within China begins to generate ever increasing obsolete volumes.
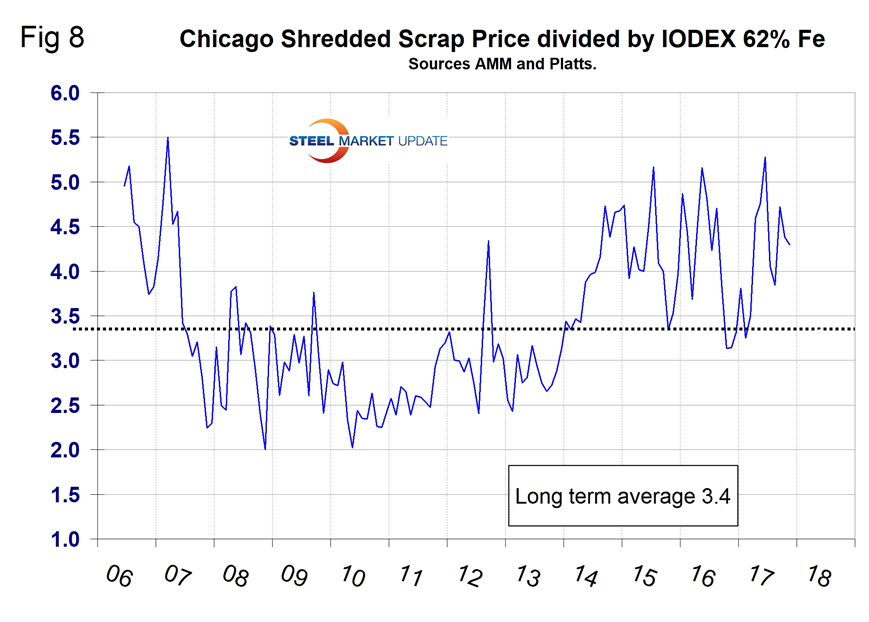
China’s steel production is 93 percent BOF, and the Chinese have recently shut most or all of their induction furnace capacity due to pollution problems. In the long run, China will reduce its dependence on iron ore in preference for scrap, but considering the country’s already huge surplus in capacity, new investments in EAFs can be expected to be slow. Turkey’s import tonnage declined in 2014 and 2015 and bounced back strongly in the last six quarters. Part of the reason for these gyrations was the purchase of semi-finished billets and slabs, from China in particular. When the price of scrap is high relative to the price of iron ore as it is today, China can ship semi-finished around the world at prices competitive with scrap. The price ratio of scrap to ore has a long-term average of 3.4, but in November 2017 was 4.3 as shown in Figure 8.
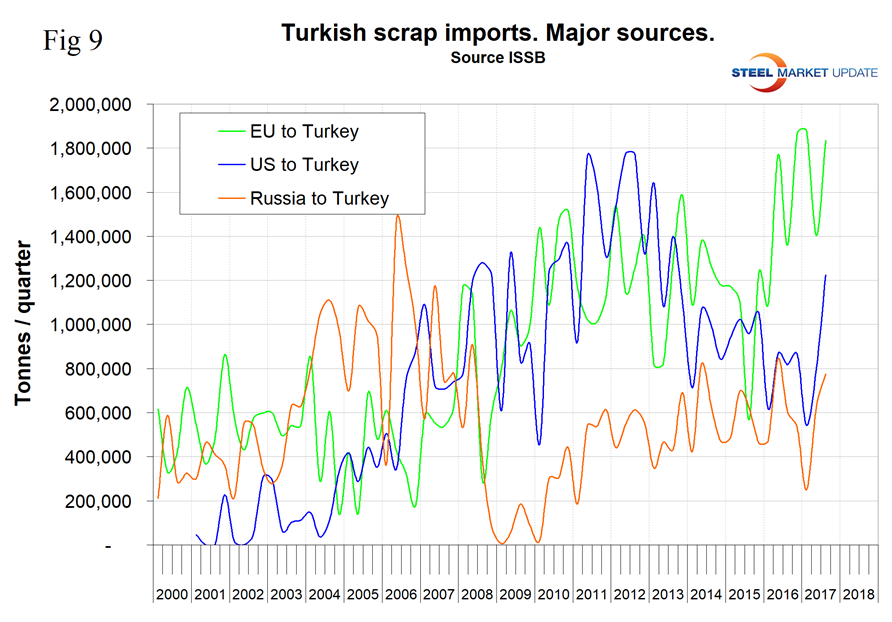
In the period 2010 through 2013, Turkey purchased a similar tonnage from the U.S. as it did from the EU, but as the euro declined in U.S. dollar terms, EU scrap become more attractive, and in 2016 European shipments to Turkey surged to over double the U.S. tonnage (Figure 9). In 2017, this situation began to reverse as the U.S. dollar declined in value through Sept. 8.
SMU Comment: We see three out of five trends in this analysis putting upward pressure on U.S. domestic scrap prices in 2017. And we see a huge disruption of the global scrap market on the horizon.
- Global scrap trade has increased from a recent low point in Q1 2016.
- U.S. global share has been declining for five years with a partial recovery in the last five quarters.
- China is not yet a player as a global scrap exporter, but we have to believe that a dramatic change is near at hand as the massive consumption of steel in China is increasingly recycled to obsolete scrap.
- For much of the last four years, including today, the price ratio of iron ore to scrap has made semi-finished out of China attractive compared to scrap.
- The U.S. dollar weakened in the first eight months of 2017, which has led to an increase in the U.S. global share of the scrap market in the first three quarters of 2017. U.S. scrap exports increased by 17.6 percent year-to-date through October.
The post Global Scrap Trade: China’s a Net Exporter! appeared first on Steel Market Update.


