
Market

December 23, 2016
Global Scrap Trade through Q3 2016
Written by Peter Wright
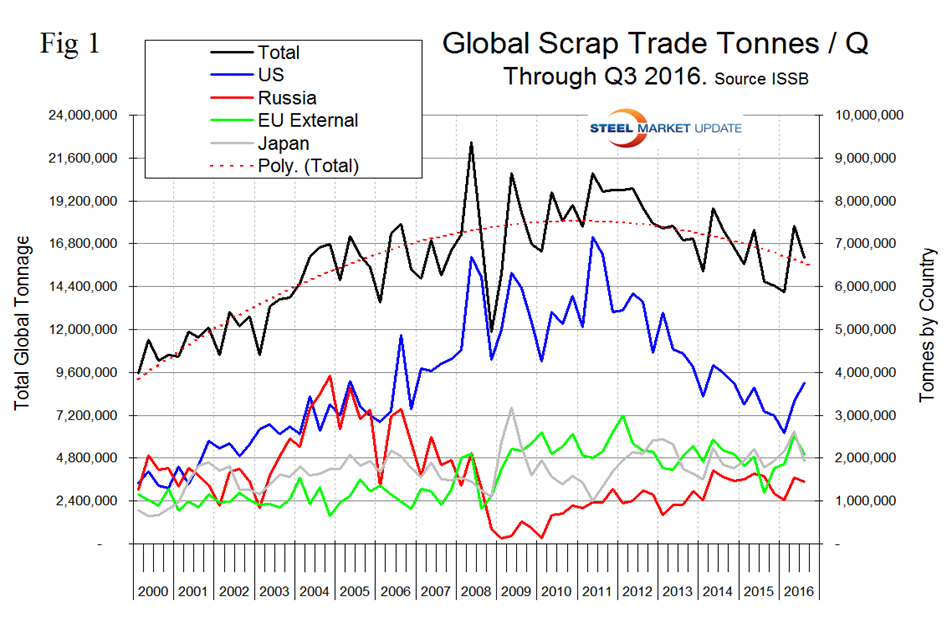
This is our first ever write up of global scrap trade. We believe that to understand the gyrations of the domestic scrap market we should study where the US stands as a global player. This data is not very current because some nations are slow to report but we still believe it gives a valuable perspective of global trends and is the foundation of where we are today. In this analysis we have excluded scrap that was traded within the EU from the global total. Figure 1 shows the total volume of ferrous scrap traded between nations since Q1 2000 and that the first quarter of 2016 was the lowest since Q1 2006 then bounced back in Q2 of this year to 17.8 million tonnes.
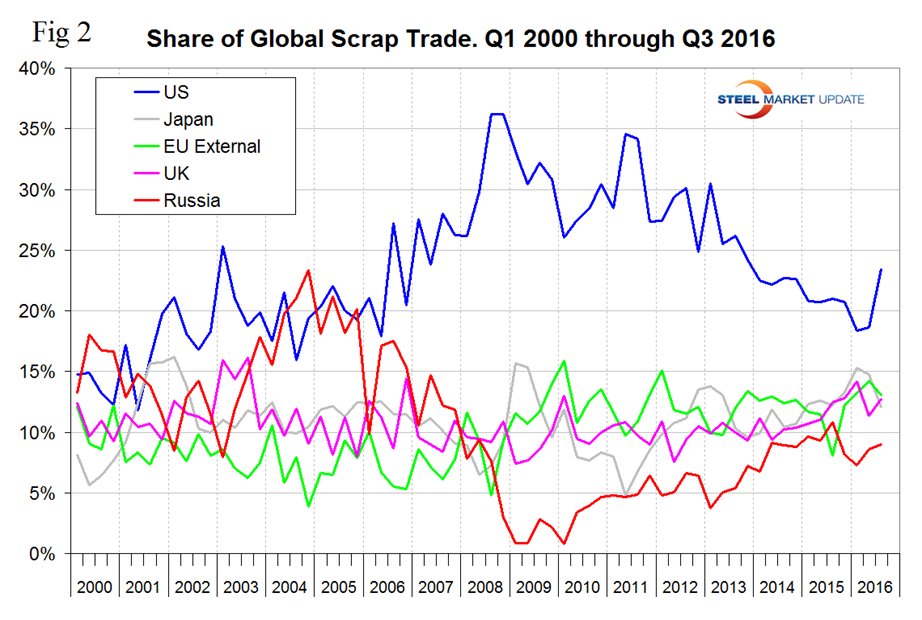
Q3 fell back to just over 16 million tonnes. The tonnage of exports from the US has declined for five years with a bit of a rebound in Q2 and Q3 2016. Figure 2 shows the global market share of the five major players. These are the US, Japan, the EU, the UK and Russia.
The US is still the biggest player on a tonnage basis and even more so on a global share basis. The US share peaked at 36.2 percent in the third and fourth quarters of 2008, fell steadily to 18.3 percent in the 1st quarter of this year and recovered to 23.4 percent in the third quarter. We attribute the long term US situation to both a decline in actual global commerce and the strengthening of the US $. The other four major players have maintained their share, in other words all of the global decline in total trade between Q2 2011 through Q1 of this year has been at the expense of the US. In Q2 and Q3 of this year that changed and the US share increased rather dramatically. The US $ weakened in these two quarters though was still high in a 10 year time frame. The increased share that the US experienced in Q2 and Q3 was a contributing factor to the strengthening of domestic scrap prices this year which is why we think we should keep our eye on this ball.
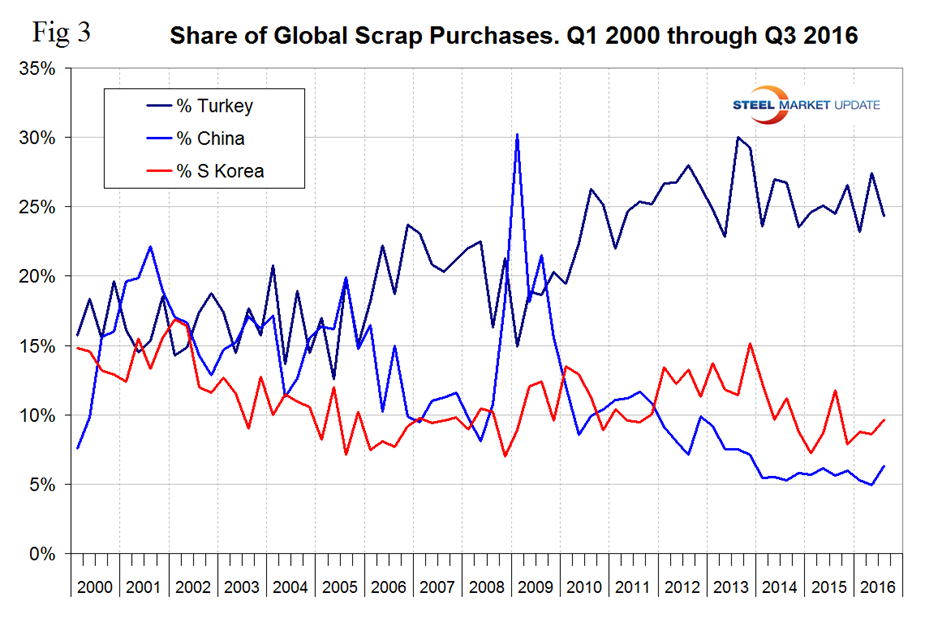
Turkey the largest global scrap buyer and has seen its share of total global purchases remain fairly constant at around 25 percent for the last 4.5 years (Figure 3).
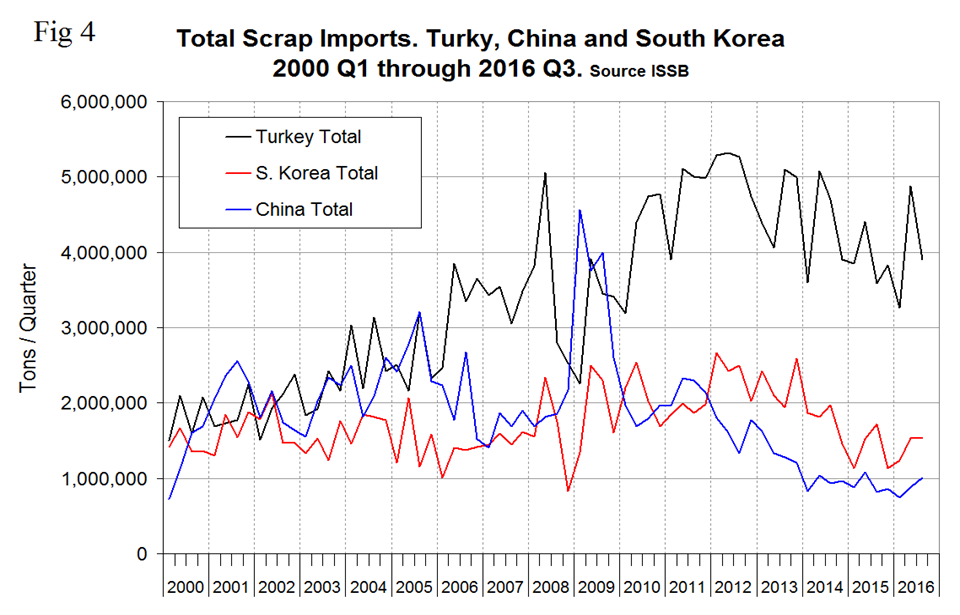
We include China in this chart even though they are not much of a player on either side of the scrap trade equation. We expect that to change as the massive consumption of steel within China begins to be recycled. China’s steel production is 93 percent BOF therefore there will be a time when huge tonnages of scrap hit the global market. In the long run China will reduce its dependence on iron ore in preference for scrap but considering their already huge surplus in capacity, new investments in EAFs can be expected to be slow. Turkey’s actual import tonnage has been on a downward trend for 3.5 years as it followed the decline in the global total, Figure 4, however there was a strong bounce back in the third quarter.
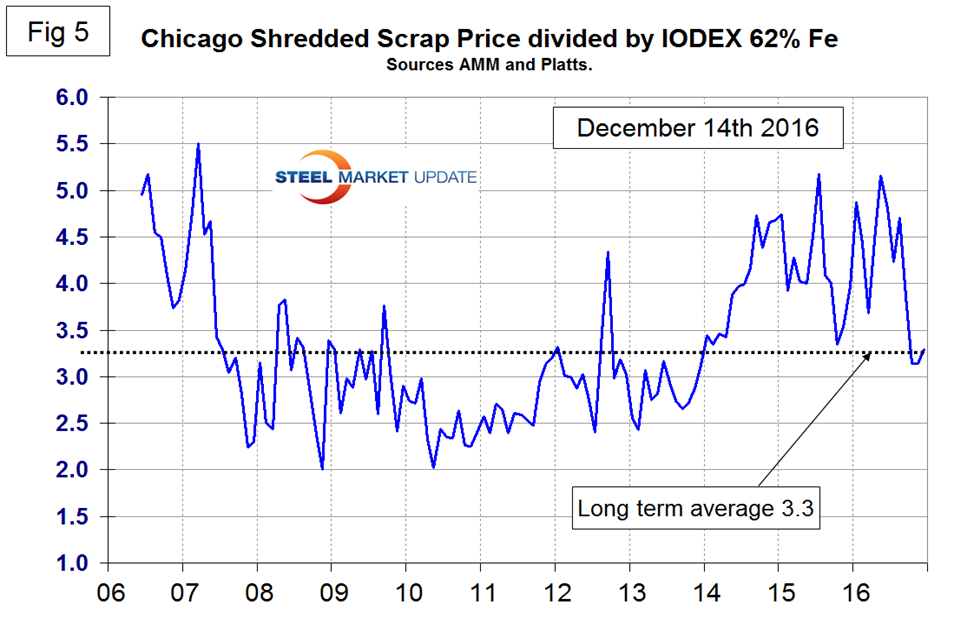
Part of the reason why Turkish buys have declined is that they have been purchasing semi-finished billets and slabs from China in particular. Chinese semi-finished was lower cost than the Turkish EAF mills could produce for themselves during the period mid-2014 through mid-2016 because iron ore was advantageously prices vs scrap and as mentioned earlier the Chinese producers are 93 percent BOF. As of December 2016 this situation has now corrected and the price ratio of scrap to ore is back to its long term average of 3.3 as shown in Figure 5.
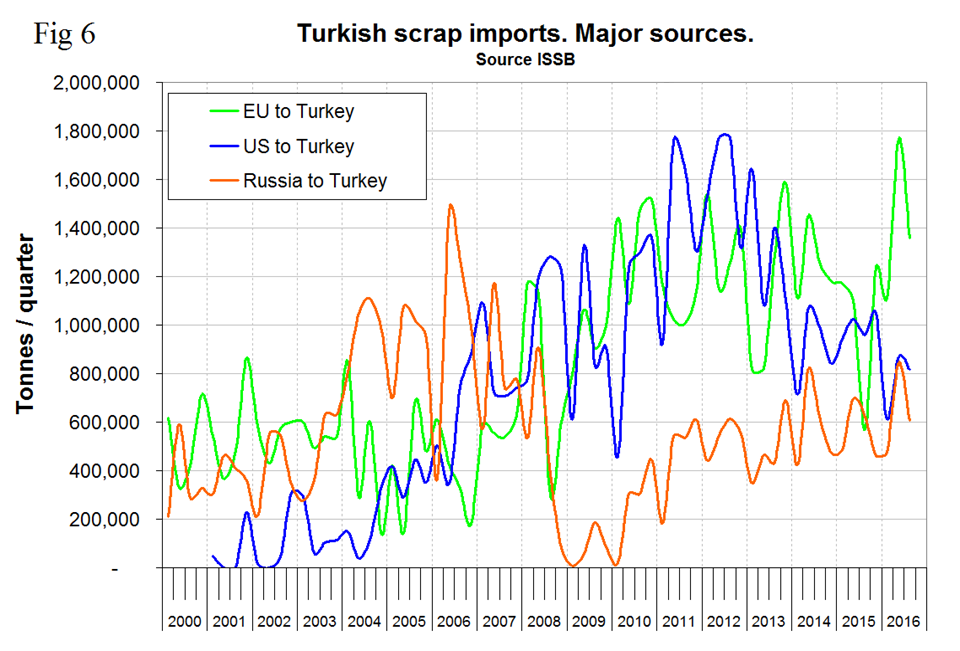
This has been another contributor to the recent strengthening of domestic scrap prices in the US. In the period 2010 through 2013 Turkey purchased a similar tonnage from the US as it did from the EU but as the Euro has declined in US dollar terms their scrap has become more attractive and in Q2 of this year European shipments to Turkey surged to over double the US tonnage. There was a correction in the third quarter (Figure 6).
SMU Comment: We have conflicting trends here all of which affect the domestic US scrap market. On balance we think that these trends will provide upward pressure on US domestic scrap prices as we move into 2017.
- Global scrap trade declined through the first two quarters of 2016 but increased strongly in the second quarter and held most of that gain in the third.
- US global share declined for over 4 years but bounced back in the second and third quarters of 2016.
- China is not yet a player in global scrap trade but will be on the supply side.
- In the two years from mid-2014 through mid-2016, the price ratio of iron ore to scrap made semi-finished out of China attractive compared to scrap. This is no longer the case.
- The US $ will continue to strengthen as the Fed raises its target rate in 2017. This will dampen US scrap exports to some extent.
The post Global Scrap Trade through Q3 2016 appeared first on Steel Market Update.


