
Market

May 1, 2015
Key Market Indicators- April 30, 2015
Written by Peter Wright
An explanation of the Key Indicators concept is given at the end of this piece for those readers who are unfamiliar with it.
The total number of indicators considered in this analysis is currently 36.
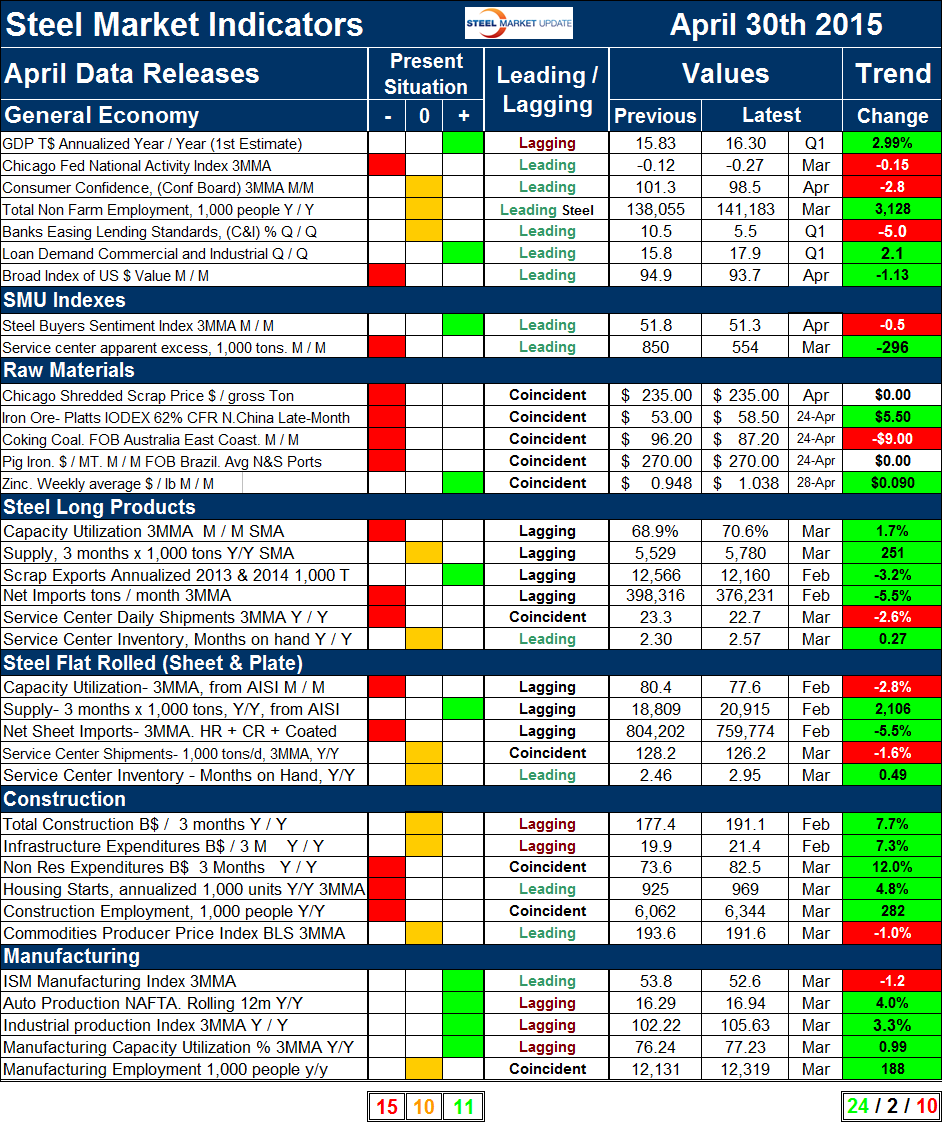
Please refer to Table 1 for the view of the present situation and the quantitative measure of trends. Readers should regard the color codes in the present situation column as a quick look at the current market condition. This is a subjective analysis based on our opinion of the level of each indicator. The “Trend” columns of Table 1, are also by their color codes designed to give a quick visual appreciation of the direction in which the market is headed. However the quantitative analysis of the value and direction of each indicator over time are the latest “facts” available. There is nothing subjective about the trends section which is designed for those readers who want to dig deeper. All data included in this table was released in April, the month or specific date to which the data refers is shown in the second column from the far right and all data is the latest available as of April 30th.
Present Situation: There was an increase of two in the negative column and a decrease of two in the neutral column in the last month. The number of indicators trending positive remained unchanged at 11. Changes this month were that we re-classified the Chicago Fed National Activity Index from positive to negative as the value fell to -0.27, negative values indicate that the economy is performing at less than the historical norm. We regard the CFNAI as an important indicator because it is a comprehensive compilation of 84 sub-indices. We changed the classification of bank lending standards from positive to neutral, this was based on our review of last month’s report, new data for Q2 2015 will be released by the Fed in the next week. There was no change in our perception of the Steel Market Update proprietary indices. In April the price of zinc rose to over $1.00/lb. and we re-classified this to be a positive situation. There were no changes in the present situation of the long steel products indicators. For flat rolled steel we re-classified capacity utilization from neutral to negative when its value fell below 78 percent. There were no changes to the present situation of either construction or manufacturing. A quick visual appraisal of the present situation shows that the general economy is mixed. Readers might wonder why we have the growth of GDP as positive after this week’s release of the data for Q1 2015. Our reasoning is that on a trailing 12 months basis GDP is up by 2.99 percent which we regard as positive and which is in line with long term expectations. Steelmaking raw materials are historically weak through April’s data. The present situation of the flat rolled steel sector is very similar to that for long products. Capacity utilization for both is classified as negative. Net imports continue to be high for both sectors. Long product apparent supply is neutral through March (SMA data). Flat rolled continued to be positive through February’s data, (latest available from AISI), however as we have reported elsewhere, imports absorbed almost all of the market growth.
Construction continues to be weak to neutral and manufacturing continues to be neutral to strong. Both nonresidential and residential construction starts are rated historically negative as is the total number of people employed in construction. No indicators are currently rated positive in the construction category. None of the manufacturing indicators on a present situation basis are currently negative. Four are positive and one, manufacturing employment is neutral.
Trends: Twenty four of thirty six indicators are trending positive which was an increase of two from the March 30th. This is the best result since October. The number of indicators registering as positive has been hovering between 22 and 23 for the previous five months but this is an aggregate and there are significant changes in the detail. We regard this overall result as somewhat surprising given the amount of negative news in the press but it is what it is and is in general agreement with the SMU steel buyers sentiment index. The number of negatively trending indicators decreased by three from 13 to 10. Two indicator, the prices of pig iron and Chicago shredded scrap were unchanged in April.
Changes in the individual sectors are described below. (Please note in most cases this is not April data but data that was released in April for previous months.)
In the general economy, the Commerce Department released the 1st estimate of GDP for the 1st Q of 2015 on Wednesday. Even though the Q on Q result dropped by 2.0 percent the trailing 12 months result improved. In Table 1 we report GDP in trillions of dollars with the year over year growth rate which we believe is more indicative of the real situation. GDP growth is reported as 2.99 percent up from 2.38 percent in our last report. The trend of the three month moving average, (3MMA) of consumer confidence declined in April for the first time since November and is reported here as a trend reversal. The Broad Index value of the US $ reversed direction in April and declined which we regard as a positive for net steel imports. We report the “Real” monthly index in this report which is inflation adjusted.
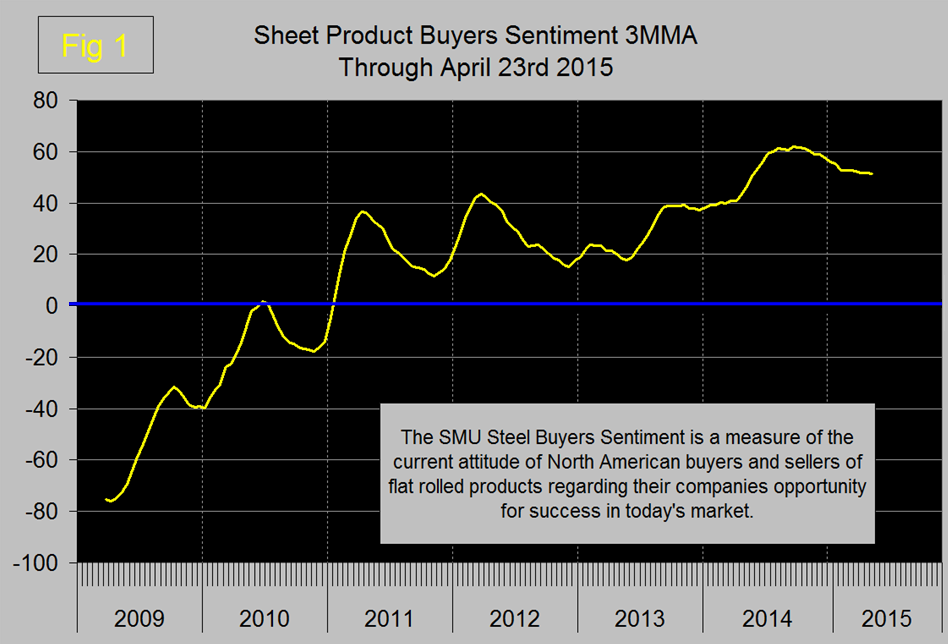
The trend of the SMU proprietary steel buyer’s sentiment index were unchanged in the April data. The steel buyer’s sentiment index is a measure of the current attitude of North American buyers and sellers of flat rolled products regarding their company’s opportunity for success in today’s market. Sentiment had been declining since it’s all-time on September 15th, it eked out a small gain in the February 12th result but since then has slid slightly. However this index is still historically strong (Figure 1).
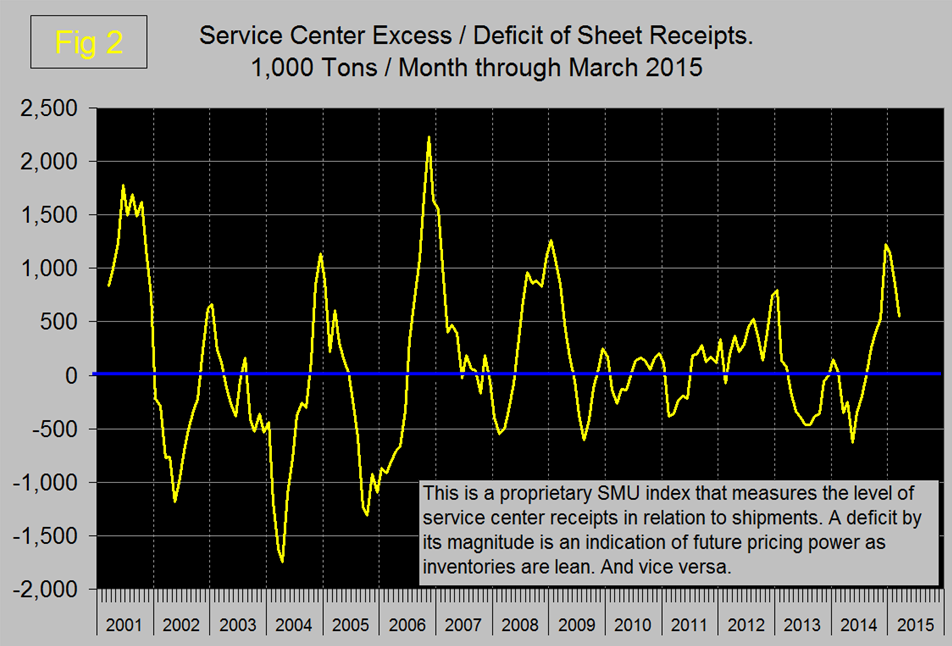
The service center excess declined in February and March (Figure 2), which we regard as a positive trend. This indicator was developed by SMU for sheet products and when in surplus as it is today indicates excess inventories and weak pricing power. SMU is forecasting an excess through July, which is as far out as we look in this context.
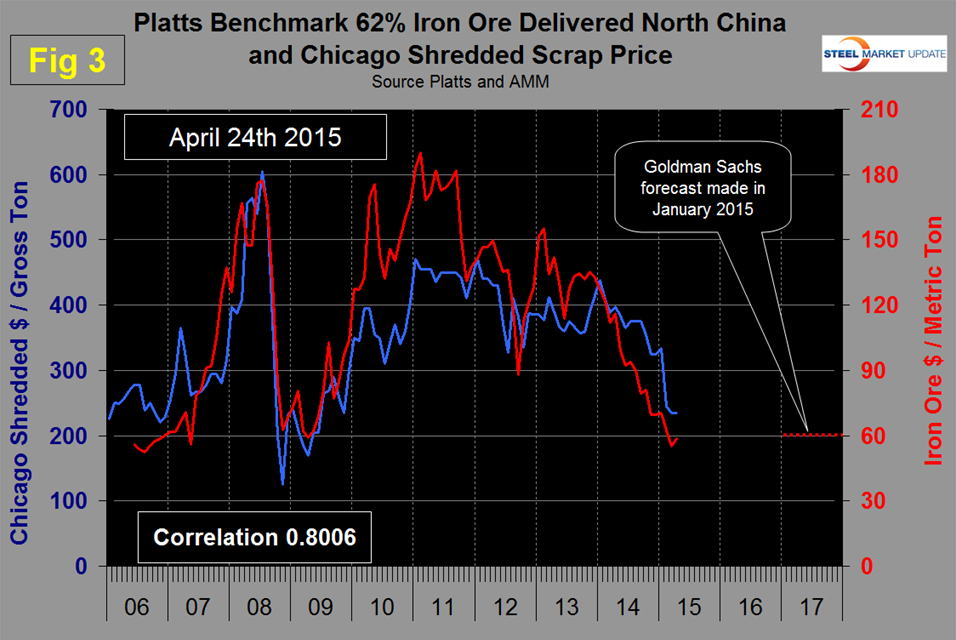
There were major changes in the trends of raw material prices. Chicago shredded scrap which had declined in February and March was unchanged in April. The long term relationship between the prices of Chicago shredded and the IODEX has been 3.2, with quite a wide spread in each direction (Figure 3).
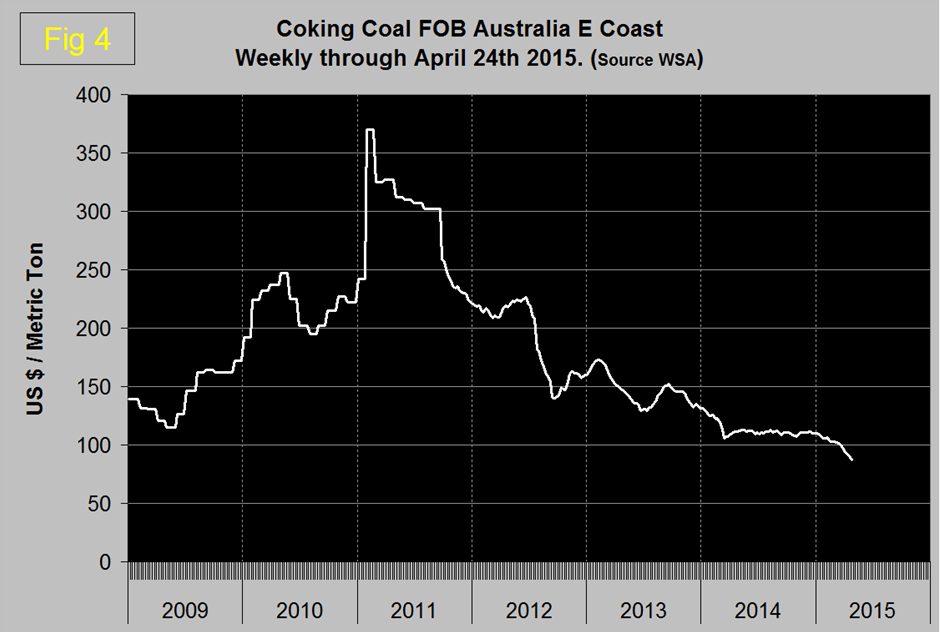
For four years through December 2013 scrap was advantageously priced on a historical basis compared to ore. Throughout 2014 scrap became increasingly uncompetitive and today the ratio is 4.0. This is a big deal in the US flat rolled business where the EAF producers have been taking share from the integrateds since 1995. It also gives a competitive advantage to those long product manufacturers overseas who are blast furnace based, China in particular. The 2.1 billion tonne iron ore market is suffering from over supply and declining demand as Chinese steel production slows. UBS forecasts excess seaborne supply to reach 215 million tonnes in 2018, five times this year’s surplus. Having said that there was an increase of $5.50 in the last month but this does not auger a real recovery in the price of ore in this decade. The 62 percent Fe IODEX price of iron ore delivered N. China rose to $58.50 on April 24th. The price of coking coal FOB Australia’s East Coast declined a further $9.00 in the four weeks through April 24th. There has been a steady decline in the price of coal this year after being quite flat for the final three quarters of last year (Figure 4).
The price of pig iron (an average of Brazilian N and S port exports FOB) was unchanged at $270/metric ton in April but on the 24th the price from the South ports was declining and reached $267.50 and from the North ports was rising and reached $272.50. The price of zinc trended positive for the second month and gained 9 cents/lb. in four weeks through April 24th month over month. On May 24th we will begin a separate monthly analysis in the Steel Market Update showing long term graphical trends for the prices of scrap, iron ore, coke and zinc.
In the long products section capacity utilization reversed course and trended positive in March and scrap exports declined providing a trend reversal to positive. The trend in the supply of long products continued to be positive. Service center daily shipments reversed course with a negative trend in the March data from MSCI.
In the flat rolled section, (total of sheet and plate) the only trend change was for service center shipments which had been unchanged in the February data but declined in March. Capacity utilization continued to decline and apparent supply driven by imports continued to increase. Net sheet imports have been down for four straight months so no trend change there. Note that capacity utilization and supply of long products are one month more current that for flat rolled because the SMA gets their data out faster than does the AISI.
In the construction section there were no changes in the direction of trends, only one indicator, the price of commodities is trending negative. We regard this indicator as a driver of industrial construction starts which are strongly driven by energy projects. Nonresidential and residential construction starts continue to improve but as we have reported elsewhere they both have a long way to go.
The seven month string where all manufacturing trends were positive was broken in December when the ISM index reversed direction and experienced a small, 0.1 decline. In January through March that decline continued. The result for April released on May 1st and which is not included in Table 1 was unchanged at 51.5 though the 3MMA did continue to decline. The industrial production index and auto production continue to expand on a year over year basis. Manufacturing employment grew by 188,000 year over year, less than construction which added 282,000 positions. Undoubtedly manufacturing is slowing and the strength of the US $ is one probable cause however the train is still rolling.
The key indicators analysis is still looking good. SMU has several benchmark analyses that show steel demand has recovered more slowly than the general economy and is still not where it should be at this stage of a recovery. Steel supply was up for both long and flat products year over year but in the three months through February was down by 7.3 percent and 8.1 percent respectively compared to three months through November. This seems to be more than a seasonal decline.
We believe a continued examination of both the present situation and direction is a valuable tool for corporate business planning.
Explanation: The point of this analysis is to give both a quick visual appreciation of the market situation and a detailed description for those who want to dig deeper. It describes where we are now and the direction in which the market is headed and is designed to give a snapshot of the market on a specific date. The chart is stacked vertically to separate the primary indicators of the general economy, of proprietary Steel Market Update indices, of raw material prices, of both flat rolled and long product market indicators and finally of construction and manufacturing indicators. The indicators are classified as leading, coincident or lagging as shown in the third column.
Columns in the chart are designed to differentiate between where the market is today and the direction in which it is headed. It is quite possible for the present situation to be predominantly red and trends to be predominantly green and vice versa depending on the overall direction of the market. The present situation is sub-divided into, below the historical norm (-), (OK), and above the historical norm (+). The “Values” section of the chart is a quantitative definition of the market’s direction. In most cases values are three month moving averages to eliminate noise. In cases where seasonality is an issue, the evaluation of market direction is made on a year over year comparison to eliminate this effect. Where seasonality is not an issue concurrent periods are compared. The date of the latest data is identified in the third values column. Values will always be current as of the date of publication. Finally the far right column quantifies the trend as a percentage or numerical change with color code classification to indicate positive or negative direction.
The post Key Market Indicators- April 30, 2015 appeared first on Steel Market Update.


