
Market

June 1, 2015
Key Market Indicators- May 31 2015
Written by Peter Wright
An explanation of the Key Indicators concept is given at the end of this piece for those readers who are unfamiliar with it.
The total number of indicators considered in this analysis is currently 36.
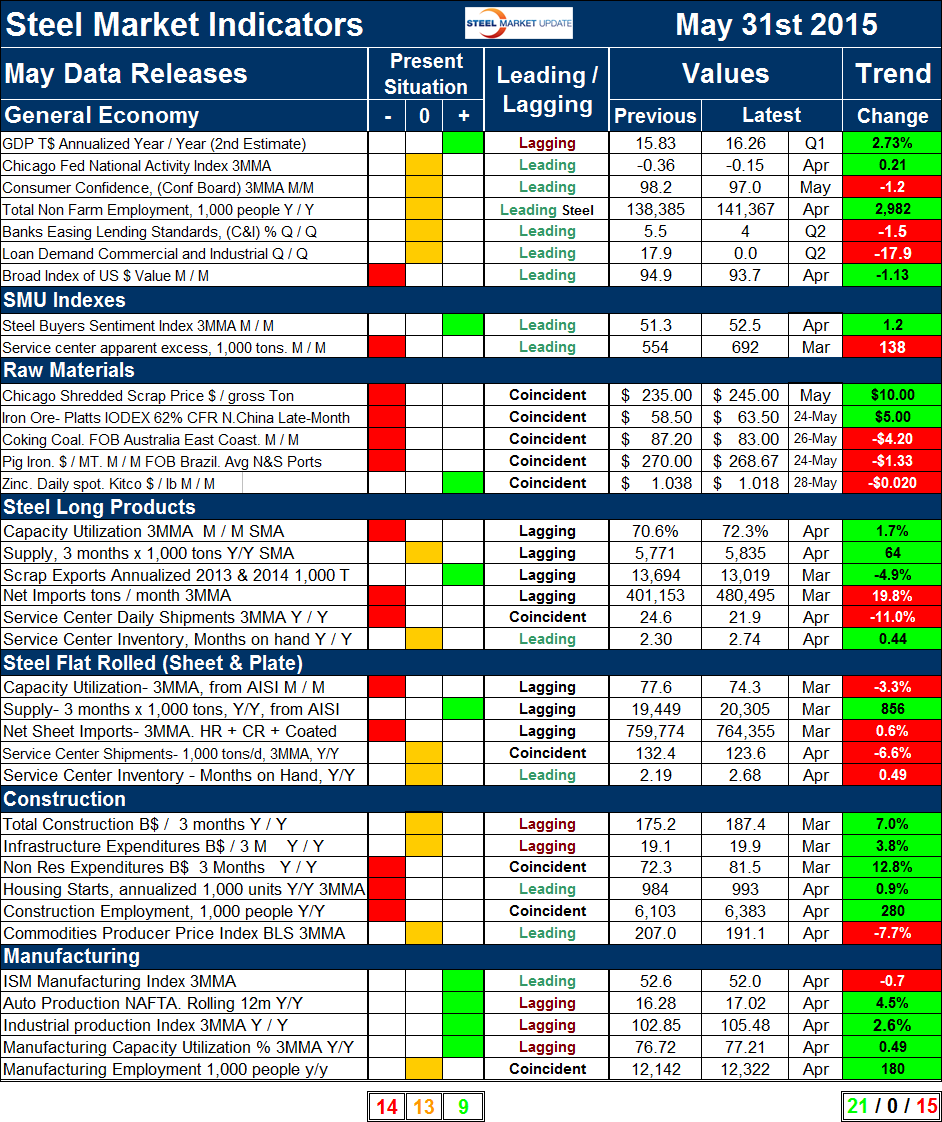
Please refer to Table 1 for the view of the present situation and the quantitative measure of trends. Readers should regard the color codes in the present situation column as a quick look at the current market condition. This is a subjective analysis based on our opinion of the level of each indicator. The “Trend” columns of Table 1, are also by their color codes designed to give a quick visual appreciation of the direction in which the market is headed. However the quantitative analysis of the value and direction of each indicator over time are the latest ‘facts’ available. There is nothing subjective about the trends section which is designed for those readers who want to dig deeper. All data included in this table was released in May, the month or specific date to which the data refers is shown in the second column from the far right and all data is the latest available as of May 31st.
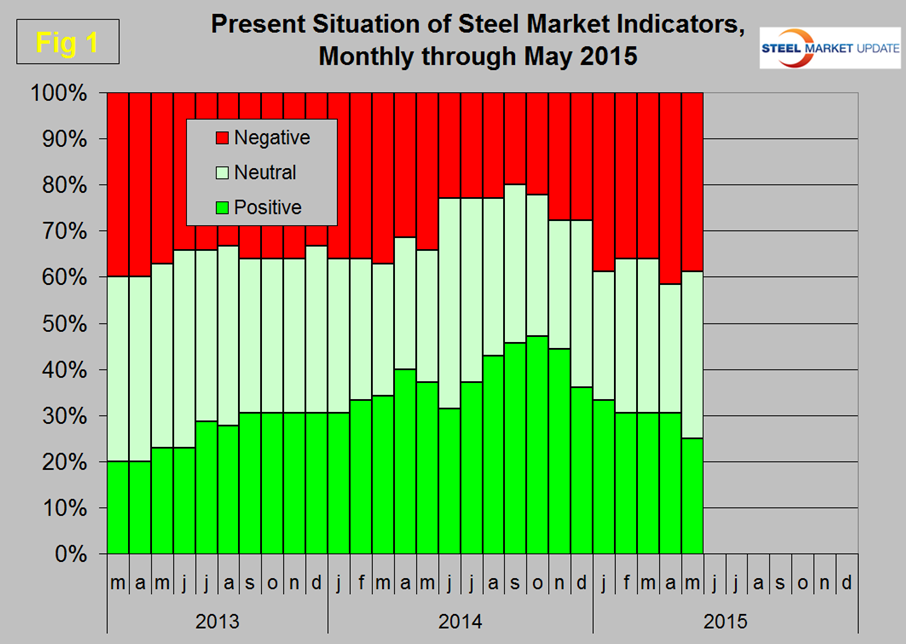
Present Situation: There was a decrease of one in the negative column, an increase of two neutrals and a decrease of one positive indicators in the last month which currently summarizes to 14, 13 and 9 respectively. We have now been conducting this analysis for 27 months which we think is long enough to graph the changes in the present situation and trends over time. Figure 1 shows the change in our assessment of the present situation since March 2013.
The number of indicators classified as positive peaked at 17 in October last year and now stands at 9 with a steadily declining trend. Changes that occurred in the month of May were as follows. The Chicago Fed National Activity Index (CFNAI) improved from negative to neutral. We have a high regard for the value of this index which is a composite of 84 sub-indexes. The demand for commercial and industrial loans as reported by the Federal Reserve Senior Loan Officer Survey was re-classified from positive to neutral. There was no change in our perception of any other indicators in the May data. A quick visual appraisal of the present situation shows that the general economy is basically neutral. Readers might wonder why we have the growth of GDP as positive after this week’s negative report for Q1 2015. Our reasoning is that on a trailing 12 months basis GDP is up by 2.73 percent which we regard as positive and which is in line with long term expectations. Steelmaking raw materials are historically weak through April’s data. The present situation of the flat rolled steel sector is very similar to that for long products. Capacity utilization and net imports for both are classified as negative. Long product apparent supply is neutral through April (SMA data), flat rolled continued to be positive through March’s data (latest available from AISI), however as we have reported elsewhere, imports absorbed almost all of the market growth.
Construction continues to be weak to neutral and manufacturing continues to be neutral to strong. Both nonresidential and residential construction starts are rated historically negative as is the total number of people employed in construction. No indicators are currently rated positive in the construction category. None of the manufacturing indicators on a present situation basis are currently negative. Four are positive and one, manufacturing employment is neutral.
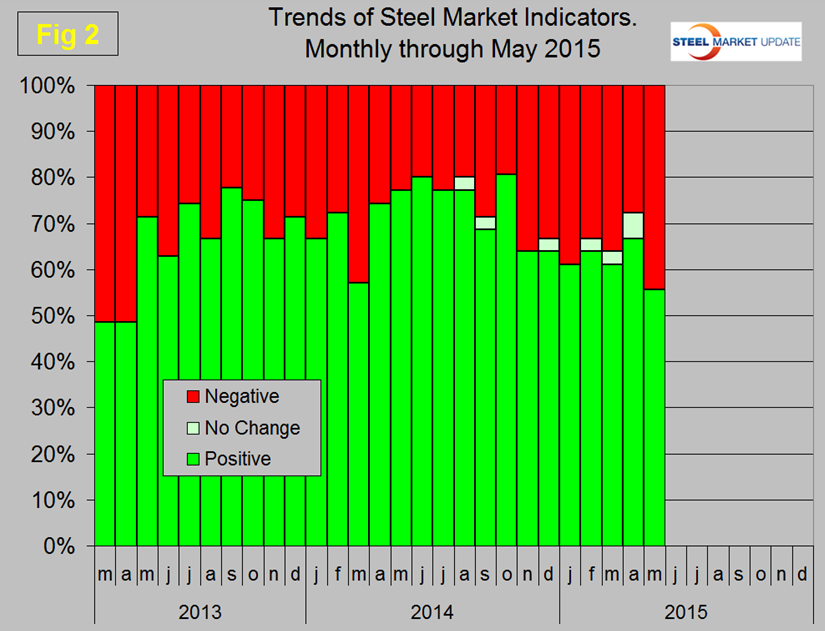
Trends: Twenty of thirty six indicators are trending positive which was a decrease of four from the April 30th data. Sixteen are trending negative which was an increase of six, as two indicators that had been unchanged in April (Chicago shredded and pig iron prices) went into reverse in May. Figure 2 shows the trend of the trends.
For all of this year until this latest report over 60 percent of the 36 indicators have been trending positive, the result for May was 55.6 percent which we still regard as an encouraging situation through down from Q2 and Q3 last year. This analysis seems to fly in the face of the preponderantly negative news in the press but it is what it is and is in general agreement with the SMU steel buyers sentiment index.
Changes in the individual sectors are described below. (Please note in most cases this is not May data but data that was released in May for previous months.)
In the general economy, the Commerce Department released the 2nd estimate of GDP for the 1st Q of 2015 on Friday as an annualized growth rate of negative 0.7 percent. The Bureau of Economic Analysis is currently under pressure to revise its procedure for seasonal adjustment which is believed to penalize results in the first quarter. This is why at SMU we prefer to report year over year results in all our data to remove seasonality and on this basis the growth of GDP is historically OK. Not terrific but not depressing either. Figure 3 shows the performance of GDP both as the headline number reported by the BEA and on a trailing 12 months basis.
In Table 1 we report GDP in trillions of dollars with the year over year growth rate which we believe is more indicative of the real situation. The trend of the CFNAI reversed from negative to positive and demand for commercial and industrial loans moved in the other direction. The trend of the three month moving average (3MMA) of consumer confidence which declined in April for the first time since November declined again in May.
The trend of the two SMU proprietary indexes both reversed course in the May data. The steel buyer’s sentiment index is a measure of the current attitude of North American buyers and sellers of flat rolled products regarding their company’s opportunity for success in today’s market. Sentiment had been declining since its all-time high on September 15th, it eked out a small gain in the February 12th result, slid slightly in March and April then once again trended positive in May. This index is still historically strong. The service center excess declined in February and March but increased in April which we regard as a negative trend. This indicator was developed by SMU for sheet products and when in surplus as it is today indicates excess inventories and weak pricing power. SMU is forecasting an excess of 381,000 tons in September which is as far out as we look in this context.
There were major changes in the trends of raw material prices. Chicago shredded scrap which had declined in February and March, was unchanged in April then rose by $10 in May which we regard as a positive trend. Pig iron which was also unchanged in lasts months report declined by $1.33 in April. China Metal’s Weekly forecasts that pig iron prices will continue to weaken in the short term. The positive trend in the IODEX 62 percent Fe delivered N. China continued through May 24th when it reached $63.50/dmt. The price of coking coal FOB Australia’s East Coast continued to decline through May 26th. There has been a steady decline in the price of coal this year after being quite flat for the final three quarters of last year. The price of zinc trended positive in March and April but took a step back in May through the 24th when its spot price was $1.018/lb.
In the long products section, net imports which had been trending positive went into reverse in March. Capacity utilization and apparent supply continued to improve but service center shipments declined for the second straight month. As service center shipments declined, inventories went up which we regard as the worst of both worlds.
In the flat rolled section (total of sheet and plate), net imports which had trended positive in February reversed direction in March which is the latest trade data available at this level of detail. Capacity utilization continued to decline and apparent supply driven by imports continued to increase. Note that capacity utilization and supply of long products are one month more current that for flat rolled because the SMA gets their data out faster than does the AISI. At the service center level we see the same situation for flat rolled as described for longs. Shipments continued to decline as inventories increased. The inventory trend was negative and was a reversal.
In the construction section there were no changes in the direction of trends, only one indicator, the price of commodities is trending negative. We regard this indicator as a driver of industrial construction starts which are strongly driven by energy projects. Nonresidential and residential construction starts continue to improve but as we have reported elsewhere they both have a long way to go. On a year over year basis, the growth of employment in construction now exceeds that for manufacturing.
The seven month string where all manufacturing trends were positive was broken in December when the ISM index reversed direction and experienced a small, 0.1 decline. The ISM index has now declined for five straight months and in April stood at 51.97 which still identifies growth but the trend is disturbing. In April the y/y growth of the 3MMA of the Industrial Production Index declined for the third straight month to 2.6 percent. The year/year growth of auto production in NAFTA continues to expand at >4 percent but the growth in the US, Canada and Mexico through April was 2.9 percent, negative 8.9 percent and 12.2 percent respectively.
The key indicators analysis is still generally positive. SMU has several benchmark analyses that show steel demand has recovered more slowly than the general economy and is still not where it should be at this stage of a recovery.
We believe a continued examination of both the present situation and direction is a valuable tool for corporate business planning.
Explanation: The point of this analysis is to give both a quick visual appreciation of the market situation and a detailed description for those who want to dig deeper. It describes where we are now and the direction in which the market is headed and is designed to give a snapshot of the market on a specific date. The chart is stacked vertically to separate the primary indicators of the general economy, of proprietary Steel Market Update indices, of raw material prices, of both flat rolled and long product market indicators and finally of construction and manufacturing indicators. The indicators are classified as leading, coincident or lagging as shown in the third column.
Columns in the chart are designed to differentiate between where the market is today and the direction in which it is headed. It is quite possible for the present situation to be predominantly red and trends to be predominantly green and vice versa depending on the overall direction of the market. The present situation is sub-divided into, below the historical norm (-) (OK), and above the historical norm (+). The “Values” section of the chart is a quantitative definition of the market’s direction. In most cases values are three month moving averages to eliminate noise. In cases where seasonality is an issue, the evaluation of market direction is made on a year over year comparison to eliminate this effect. Where seasonality is not an issue concurrent periods are compared. The date of the latest data is identified in the third values column. Values will always be current as of the date of publication. Finally the far right column quantifies the trend as a percentage or numerical change with color code classification to indicate positive or negative direction.
The post Key Market Indicators- May 31 2015 appeared first on Steel Market Update.


