
Market

July 31, 2014
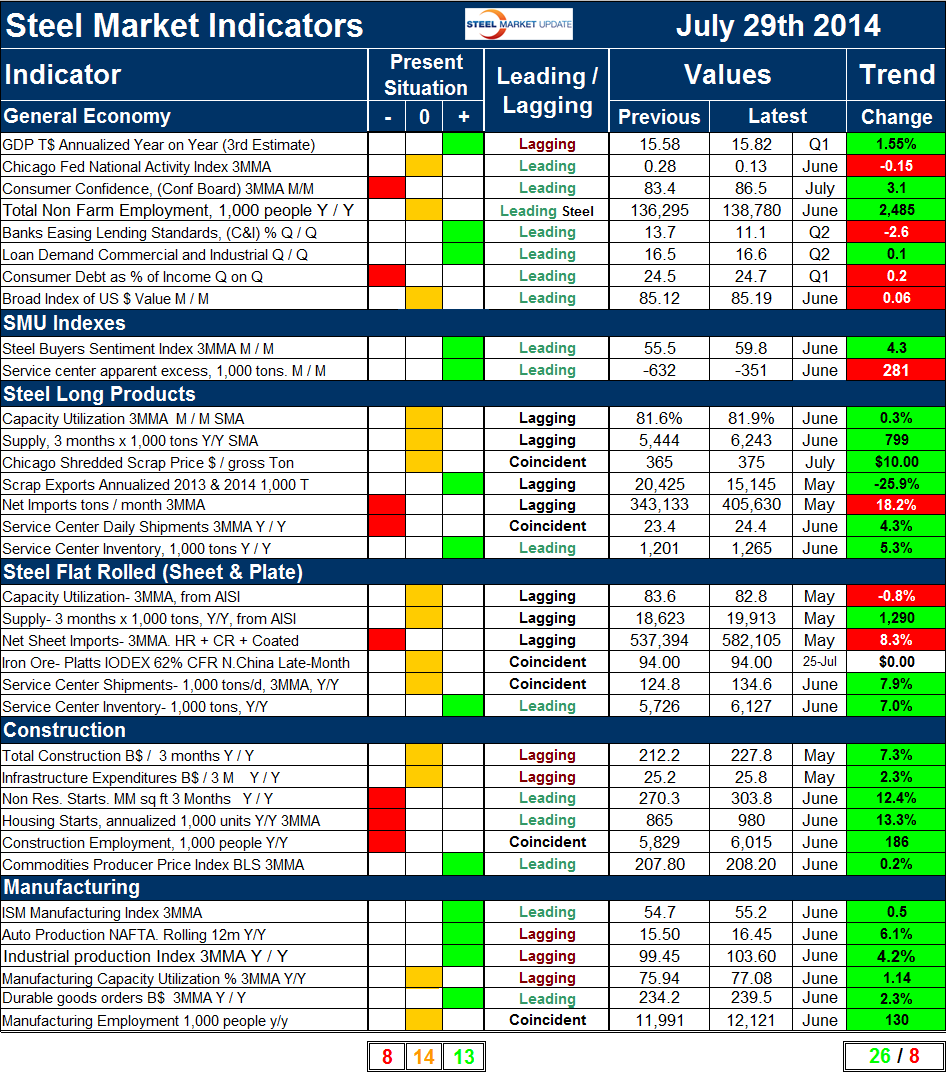
SMU Key Steel Market Indicators Shows Increase in Positive Indicators
Written by Peter Wright
The SMU Key Market Indicators is a Premium Level product produced by Peter Wright in collaboration with Steel Market Update. Our Executive Level members have been getting access to all of the Premium Level data for the month of July (today is the last day). This includes access to all of the Premium data which is included in our website (most being under the Analysis tab). Today and tomorrow (Thursday & Friday) are the last days for Executive Level members to access Premium Level data.
The purpose of the Key Market Indicators is to provide an overview of the general economy and the steel industry and then provide a view of the trends that are occurring and if they are positive, negative or neutral for those involved in the steel industry. An more detailed explanation of the Key Indicators concept is given at the end of this piece for those readers who are unfamiliar with it.
The total number of key market indicators considered at present is thirty five, the Chicago Fed Mid-West Manufacturing Index is still on hold to enable the staff to complete a major re-vamp of the structure of their report. Please refer to Table 1 for the view of the present situation and the quantitative measure of trends. Thirteen of the present situation indicators based on historical standards were positive on July 29th and eight were negative with fourteen considered to be close to the historical norm. This is an increase of two positive and a decrease of two neutral since the last publication one month ago. These change were to service center inventories of both long and flat products. This was not an actual change in inventory levels but in how we choose to perceive them. We had been looking at absolute tonnage levels which were historically normal but we are now using months on hand as our criteria which are good for both product groups. Five of the eight negative indicators were in the steel long products and construction sectors. It makes sense that these two groups would be in harmony. This broad look confirms that it is construction that is holding steel demand lower than is normal at this time in a cyclical recovery.
Our view of the present situation of the general economy did not change in the last month and is barely OK with three indicators positive, three neutral and two negative.
Both the SMU buyer’s index and the SMU service center excess are currently positive. Service centers took in 351,000 tons less than they shipped which we interpret as positive for prices going forward as their inventories are lean. The steel buyer’s sentiment index is at an all-time high at 59.8 having increased from 55.5 at this time a month ago. The buyer’s index is based on a survey of sheet producers and consumers and is not intended to be inclusive of long product market conditions.
Present situation indicators for long products are now similar to flat rolled. Both have a negative situation in the net import category and for service center shipments the situation for long products is still negative. Both product groups have capacity utilization and total supply to the market, including imports within the band rated historically normal. The prices of Chicago shredded scrap and iron ore are also within the historically normal range. Scrap exports continue to be historically low and are color coded green. This is not an exact science and is evolving over time as we try to improve the value of the analysis. There were no other changes in the last month in our view of the flat rolled market. The price of iron ore was unchanged in the last month, if the IODEX index falls below $90 per dmt we will re-classify to negative. We consider a declining price for both iron ore and scrap to be undesirable because it suggests a weakening of the global market. In August last year Goldman Sachs forecast that the price of iron ore would decline to $85 in 2015 and so far that estimate looks on target.
Our view of the current state of both construction and manufacturing is unchanged in the last month. Both nonresidential and residential construction starts are rated historically negative as is the total number of people employed in construction. The only indicator rated positive in the construction category is the producer price index of commodities for which we believe a high value is correlated with industrial construction activity, particularly in the energy sector. None of the manufacturing indicators on a present situation basis are currently negative, four are positive and two are neutral which is unchanged in the last month.
The quantitative analysis of the value of each indicator over time is shown in the “Trend” columns of Table 1. There is nothing subjective about this section of the analysis. Reported numbers are the latest “facts” available. The total number of positive trends in July declined by two from our June 29th report with a total of 26 out of 35 indicators heading in the right direction. June was the best result in the 16 months that we have performed this analysis and the latest trends also indicate a very positive situation. Changes in the individual sectors are described below. (Please note in most cases this is not July data but data that was released in July for previous months.)
Four out of eight trends in the general economy trended negative in July, this was an increase of one which was the Broad Index value of the US dollar which strengthened slightly in June. We regard a strengthening dollar as a negative for its influence on net imports. Other indicators in this section maintained their direction. The Chicago Fed National Activity Index, (CFNAI) which is a diffusion index based on 84 sub-indexes slowed slightly in June but is still signaling expansion. A value > 50 indicates expansion and < 50 indicates contraction. Consumer confidence improved again in July and in that single month exceeded the long term average since January 1980.
The trend of the SMU steel buyer’s sentiment index continued to be positive and reached another all-time high in the second half of July. The trend of service center surplus continued to be positive in July though the apparent deficit declined from 632,000 tons to 351,000 tons. We regard a deficit as a positive because it points to lean inventories and higher future prices.
In the long product steel sector in July, six of seven indicators were trending in the right direction which was an increase of one from the June analysis. This change was a reversal in the price trend of Chicago shredded which increased by $10 in July. We consider a rising scrap price as positive as it suggests a strengthening global and domestic market. Note long product capacity utilization and steel supply data is for June and flat rolled is for May, this is because SMA, who only compile data for long products get their numbers out faster than does AISI. We use AISI data for flat rolled. Supply of long products maintained the strong surge reported in the last two months and capacity utilization increased by 0.3 percent to 81.9 percent. Shipments at the service center level increased by 4.3 percent year over year continuing that positive trend.
Of the six flat rolled steel indicators, three had a positive trend in July’s data, two were negative and one, (the price of iron ore) was unchanged. This was a decline of one in positive trends. The change was in capacity utilization which declined from 83.6 percent to 82.8 percent on a three month moving average basis. Apparent supply which is the nearest we can get to “demand” increased by 1,290,000 tons in three months through May year over year. This was driven by rising imports. On July 25th the price of iron ore was exactly the same as in our June analysis at $94.00 / DMT. Net imports of sheet products on a 3MMA basis increased for the fifth consecutive month in May, up 8.3 percent from April. Service center shipments and inventories continued to trend in a positive direction through June. Service center tons / day shipments of sheet products have now trended positive for eleven straight months.
Construction trends in June improved in six out of six indicators, as they also did in these last two monthly reports. All indicators are year over year and all except employment are three month moving averages. It now seems to be confirmed that the decline in nonresidential and residential construction starts in March was weather related and are now back on the track of positive growth, albeit with a long way to go. Housing has been struggling recently as we have reported elsewhere but this key indicators report measures a three month moving average year over year and on this basis housing us up by 13.3 percent.
In the manufacturing sector all indicators trended positive in the July data as was the case in May and June. All comparisons are year over year. The magnitude of the change in the June and July reports were similar except for durable goods which expanded more slowly in this July report.
The key indicators analysis is starting to look better in its view of the present situation and trends are very good which bodes well for the balance of 2014. SMU has several benchmark analyses that show steel demand to be below the historical norm for this stage of a recovery. This is because the recession in non residential and housing construction was so extreme that it will be years before the 2007 levels are regained. In addition government funded infrastructure work is still depressed.
We believe a continued examination of both the present situation and direction will be a valuable tool for corporate business planning.
Explanation: The point of this analysis is to give both a quick visual appreciation of the market situation and a detailed description for those who want to dig deeper. It describes where we are now and the direction in which the market is headed and is designed to give a snapshot of the market on a specific date. The chart is stacked vertically to separate the primary indicators of the general economy, of proprietary Steel Market Update indices, of both flat rolled and long product market indicators and finally of construction and manufacturing indicators. The indicators are classified as leading, coincident or lagging as shown in the third column.
Columns in the chart are designed to differentiate between where the market is today and the direction in which it is headed. It is quite common for the present situation to be predominantly red and trends to be predominantly green and vice versa. The present situation is sub-divided into, below the historical norm (-), (OK), and above the historical norm (+). The “Values” section of the chart is a quantitative definition of the market’s direction. In cases where seasonality is an issue, the evaluation of market direction is made on a three month moving average basis and compared year over year to eliminate this effect. Where seasonality is not an issue concurrent periods are compared. The date of the latest data is identified in the third values column. Values will always be current as of the date of publication. Finally the far right column quantifies the trend as a percentage or numerical change with color code classification to indicate positive or negative direction.
SMU Note: During our Steel Summit Conference, Peter Wright and John Packard will explain the Key Market Indicators and some of the components for our attendees.
If you would like to learn more about our Premium Level services you can do so on our website or feel free to contact our office: info@SteelMarketUpdate.com or by phone: 800-432-3475.
The post SMU Key Steel Market Indicators Shows Increase in Positive Indicators appeared first on Steel Market Update.


