
Market

January 17, 2016
The Relationship Between the Price of Scrap & 3 Useful Benchmarks
Written by Peter Wright
Often with steel related economic statistics it’s useful to compare a given data stream with others which may or may not be causally related. This usually puts the steel data into context and shows whether a direction change is for real. In this piece we are comparing the price of Chicago shredded scrap with the IODEX price of iron ore delivered North China, the value of the US $ and the price of oil in Cushing, Oklahoma.
The price of ore and the value of the US $ have a direct causal effect on scrap prices. There is not a causal relationship between scrap and oil but they are both global commodities with a highly correlated price ratio. Comparison with these benchmarks has enabled us to signal whether the price of scrap is out of line either on the up or down side. The price of Chicago shredded scrap rose by $30 in January to $190 per gross ton, down from $334 in January 2015.
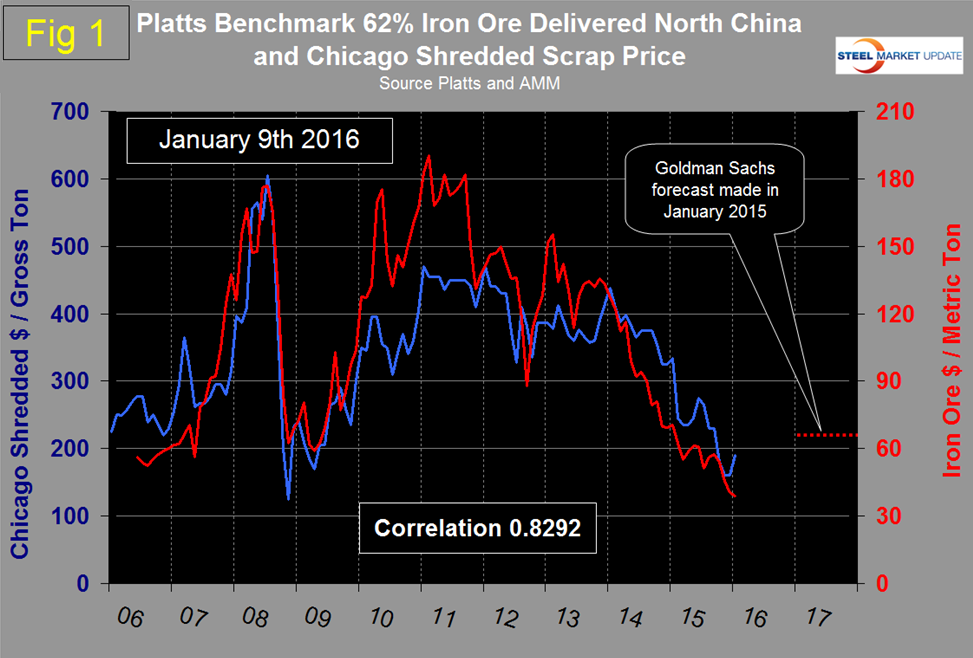
Figure 1 shows the IODEX (62% Fe delivered N. China) and the price of scrap through January 9th. The correlation since January 2006 has been 0.8292. In the period 2007 through 2009 the correlation was 0.9182 but the relationship became de-coupled in 2010 and 2011 when the big 3 ore cartel began to eliminate long term contracts.
There was a similar decoupling in the other direction up until the 3rd Q of 2015 caused by the oversupply of ore. In October the price of scrap came back exactly into line with iron ore and since then the January scrap price increase has caused the lines to separate again with scrap looking overpriced. We have superimposed the Goldman Sachs forecasts on this graph. In January 2015 GS forecasted the price would be $70 in 2017. The latest IODEX price from Platts was on the 11th at $39.01.
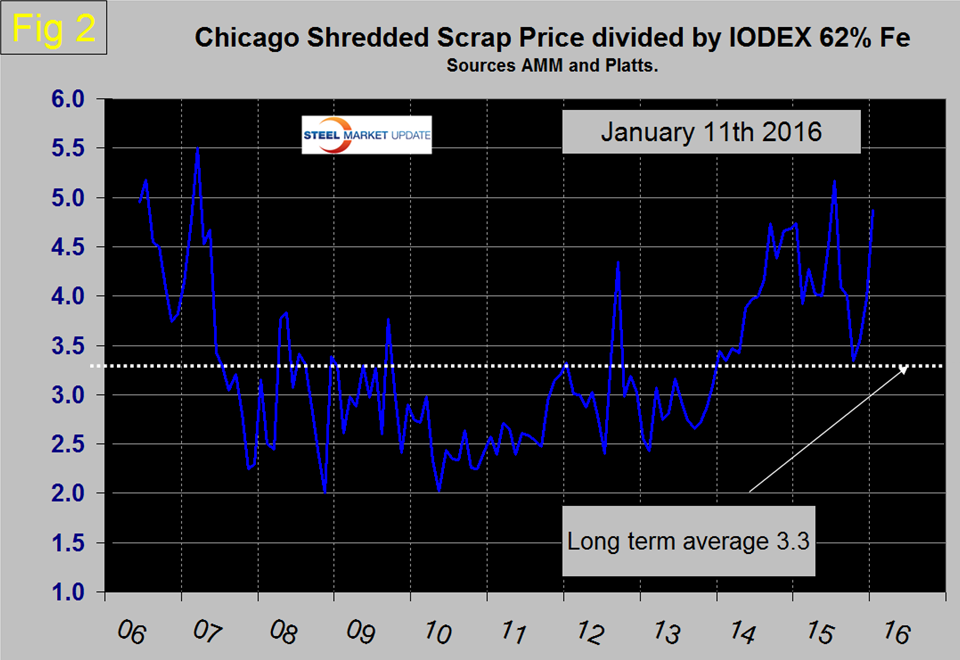
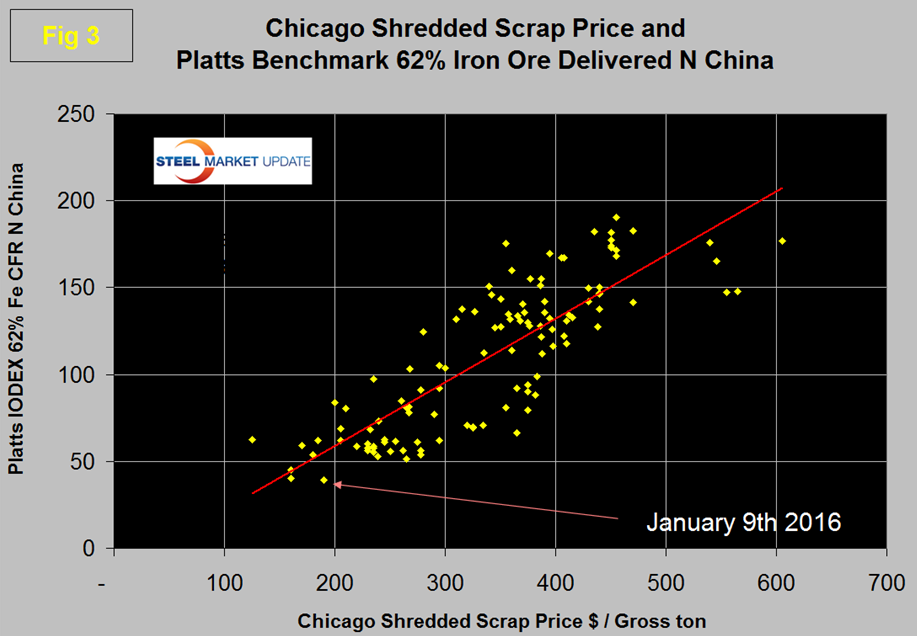
In the long term, Chicago shredded has been 3.3 times as expensive as the IODEX on average with quite a wide spread in each direction. For four years through December 2013 scrap was advantageously priced on a historical basis compared to ore. Throughout 2014 scrap became increasingly uncompetitive and in July this year reached a high of 5.2x the IODEX (Figure 2). The latest scrap price increase and iron ore decrease caused the ratio to jump from 3.97 to 4.87.
The World Steel Association data for 2014 was released recently and has China at 93 percent BOF and 7 percent EAF as a mix of steel production processes. The present advantageously priced iron ore is part of the reason why China with its high dependence on ore has been able to disrupt the global scrap market by selling low priced semi-finished. Figure 3 is a scatter diagram of scrap and ore and where we are this month.
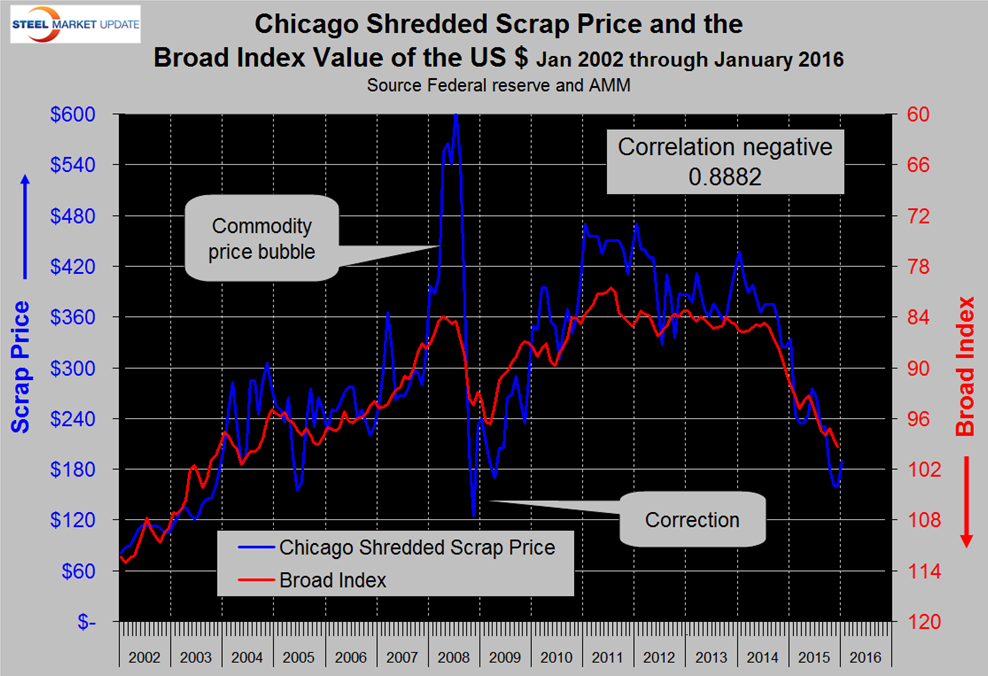
Figure 4 shows the scrap/US $ relationship which has a 0.8882 negative correlation since January 2002. An appreciating $ has a negative influence on the price of global commodities, of which scrap is one. At the present time by this benchmark, scrap is undervalued.
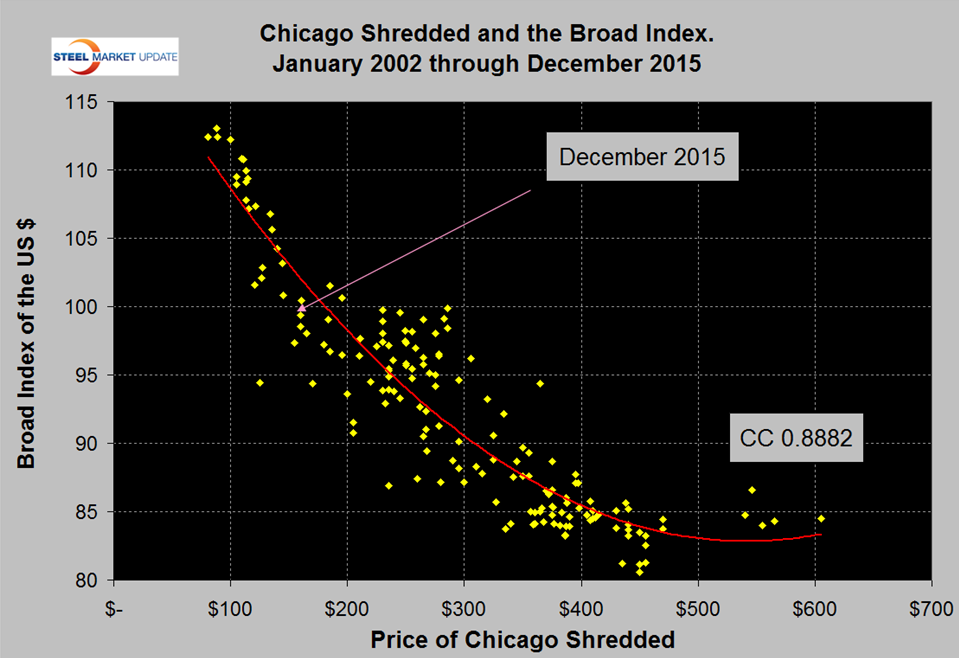
Figure 5 shows a scatter diagram of scrap and the dollar and where we are today.
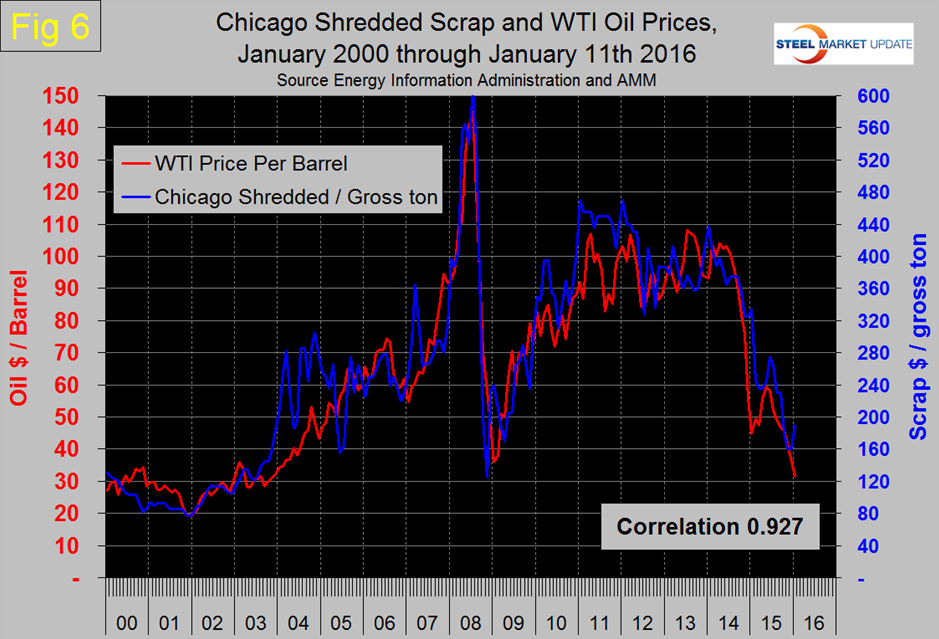
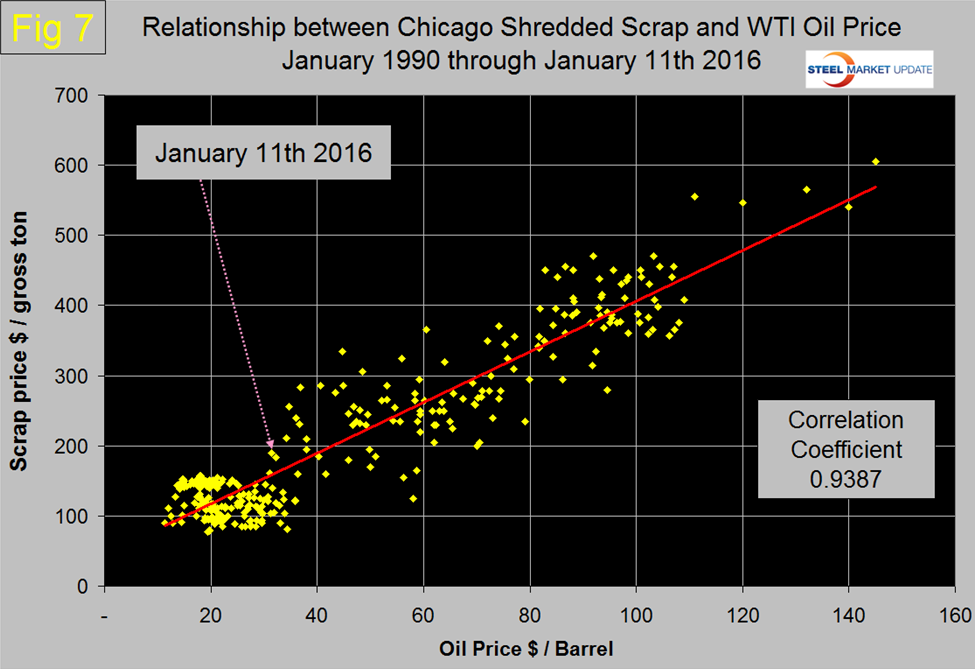
Figure 6 shows the scrap/oil relationship through January 11th with a correlation of 0.9270 since January 2000 and 0.9378 in the 25 years since January 1990. Both scrap and oil are global commodities but we estimate the world oil market to be about 50x the size of the scrap market measured in US dollars. The long term tendency has been for scrap to come back into line with oil when it deviates to either the high or low side thus providing a strong buy or hold signal which also has merit for rolled steel products as we will show in a subsequent article today.
Oil was reported in the press to have fallen below $30 this week but the latest value for West Texas Intermediate published by the Energy Information Agency was $31.42 on January 11th.
It was clear in December 2014 that if history was a guide, scrap was headed for a fall and this occurred in February. Scrap followed oil down for all of 2015. In January we have an unusual situation where scrap and oil are moving in opposite directions. Figure 7 is a scatter diagram for scrap and oil prices since January 1990 and where we are today. As of now scrap is overpriced compared to both oil and iron ore but underpriced compared to the broad index value of the US $. We are inclined to think based on these benchmarks that the January price increase of scrap was driven by collection rates and not real demand, therefore, we believe the downside for scrap is greater than the upside during the balance of the first quarter of 2016.
The post The Relationship Between the Price of Scrap & 3 Useful Benchmarks appeared first on Steel Market Update.


