Market

June 28, 2018
U.S. Ferrous Scrap Exports Up in 2018
Written by Peter Wright
U.S. scrap exports expanded by 31 percent in the first four months of 2018, while total global scrap trade has been trending up since Q1 2016.
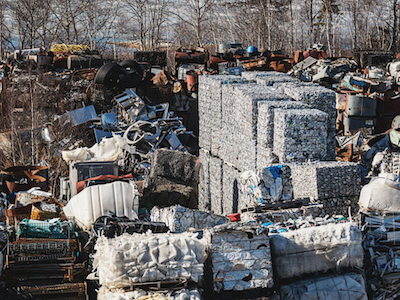
Steel Market Update performs this analysis quarterly to help readers understand the gyrations of the domestic scrap market and where the U.S. stands as a global player. This data is a quarter in arrears because some nations are slow to report, but we still believe it gives a valuable perspective on global trends and is the foundation of where we are today. All tonnages in this report are metric.
To set the scene, Figure 1 shows total scrap exports from the United States as reported by the U.S. Department of Commerce on the right axis together with the major destinations reported on the left axis. It shows the monthly average for 2004-2017 and the three-month moving average for January through April 2018. In the 12 months of 2017, U.S. scrap exports increased by 18.6 percent from the same period in 2016. In 2018 year to date, April scrap exports increased by 31.0 percent and are now back to where they were prior to 2013.
In our analysis of global scrap trade, we have excluded scrap that moved within the EU from the global total. Figures 2 and 3 show the total tonnage of global trade since Q1 2000 and the volume of the top five suppliers. These five are the U.S., the EU, the UK, Japan and Russia, and they accounted for 68.6 percent of the total in Q1 2018.
Figure 4 shows the global market share of the top five exporters. The U.S. continues to be in first place.
Figure 5 shows the negative correlation of 72.6 percent between the Broad Index value of the U.S. dollar and the U.S. share of global trade. There is also a correlation between the U.S. global share and the U.S. domestic scrap price. The result is shown in Figure 6 with a correlation of 65.0 percent. The fact that our export share increases as our domestic price increases might seem backwards at first glance. However, scrap is a global commodity and this would seem to support the view that the domestic price is driven more by export volume than by domestic demand.
Figure 7 shows the tonnage received by the four major importing nations. Turkey is by far the largest global scrap buyer with a tonnage totaling more than the other three combined. In Q1 2018, Turkey took in 27.9 percent of the global total.
The most significant occurrence in the second half of 2017 was that Chinese scrap exports took off and made them a net scrap exporter in Q3 2017. We have stated that we expect China to totally disrupt the global scrap market before the end of this decade as the massive consumption of steel within China begins to generate ever increasing obsolete volumes. We still believe this to be true, but the numbers for Q1 2018 were not supportive. We await the results for the rest of 2018 (Figure 8).
Figure 9 shows an estimated scrap balance for the U.S. and China. The recycling rate in the U.S. is 61.4 percent. We have assumed a rate of 25 percent in China because a high proportion of their consumption is in construction, which has a longer service life than manufactured products. Even so, China has a greater internal scrap surplus than the total global scrap trade. China’s steel production is 93 percent BOF and they have recently shut most or all of their induction furnace capacity due to pollution problems. In the long run, China will reduce its dependence on iron ore in preference for scrap, but considering their already huge surplus in capacity, new investments in EAFs can be expected to be slow.
Turkey’s import tonnage declined in 2015 and bounced back strongly in Q3 2017 to an all-time high of 5.9 million tons. The EU has increasingly strengthened its position as a supplier to Turkey since mid-2015 (Figure 10).
SMU Comment: Scrap expert John Harris, CEO of Aaristic Services, Inc., offered the following observations on our last quarterly scrap report:
I read with great interest your excellent quarterly review of the global scrap markets. Please note my following comments on your article. First, I believe the long-term decline of the U.S. scrap export market share is more a result of the China growth factor than strengthening dollar. All the other key scrap exporters predominately ship within their own region while the U.S. goes both East and West globally with their exports. China’s rapid growth, which wasn’t matched by its consumption, created a steel export market dynamic that threatened both Turkey and the Asia Tiger’s conversion markets (scrap in >> steel out).
Second, in the past, a strong U.S. dollar attracted steel imports from the scrap-to-steel converters in many countries like Turkey. Subsequently, their utilization rates increased dramatically, and more imported scrap was required, as you reported. Further, they had no problem buying U.S. scrap as their conversion costs were in their country’s weaker currency. This resulted in a decrease in U.S. steel prices and steel utilization rates, which subsequently reduced U.S. scrap demand. This also redirected scrap flows to East Coast ports from normal steel plant supply lines because scrappies could get a better price on the docks.
Your comment, “Domestic price is driven more by export volume than by domestic demand,” is absolutely true. Nevertheless, price is the directional signal for all U.S. monthly scrap flows. To the mills or to the docks.
The spike in China scrap imports (approximately 13 million metric tons) was a result of U.S. prices being under $150 per ton. It was a result of the 2008 market crash and utilization rates hitting unforeseen lows. The Chinese changed their BOF scrap charge rates to approximately 20 percent from the previous 3-5 percent.
Since the early 2000s, I have regularly informed conference attendees that China will control global scrap markets. There are no reasons for them to import scrap. Based on yield losses generated from their flat carbon steel processing, the amount was sufficient to satisfy their requirements. Recently, they have upped the percentage of purchased scrap to about 9 percent from 3-5 percent in an attempt to absorb more scrap. It’s NOT working, and we can definitely expect large increases in scrap exports in the near future as they perfect their logistics.
The majority of China’s steel production is near coastal ports because of their high demand for imported iron ore and met coal. This also provides for lower-cost scrap purchases from ocean cargoes, which is the reason there are still scrap imports.
Annual steel consumption in China is about 725 million metric tons, not the 998 million tons SMU reported. China’s charge scrap demand is about 116 million tons (BOF 93 percent, EAF 7 percent) and their prompt scrap generation is around 116 million tons. China’s obsolete scrap is not even required to satisfy their scrap charge requirements. Subsequently, their scrap reservoir is ballooning out of proportion.
WSA statistics identify a steel surplus in China of about 157 million metric tons. Since 2012, China has set a major emphasis on developing OBOR (one belt, one road) both on sea and land. A large portion of these projects are now entering the construction stage and any surplus steel will be absorbed quickly. They include China’s investment of $10 billion in Egypt to develop high-speed rail from Aswan to Cairo to Alexandria to connect the Mediterranean Sea and the Red Sea, and a second $2.5 billion to build an electrification project and railway in Iran from Tehran to Mashhad.
The post U.S. Ferrous Scrap Exports Up in 2018 appeared first on Steel Market Update.