Scrap Processors

June 13, 2024
US light-vehicle sales surprise, increase in May
Written by David Schollaert
U.S. light-vehicle (LV) sales rose to an unadjusted 1.43 million units in May, up 4.8% vs. year-ago levels, the U.S. Bureau of Economic Analysis (BEA) reported.
The year-on-year (y/y) growth in domestic LV sales came in with a 7.6% month-on-month (m/m) boost.
On an annualized basis, LV sales were 15.9 million units in May, up from 15.8 million units the month prior, and ahead of the consensus forecast, which called for a sideways move at 15.8 million units.
Auto sales ticked up last month, potentially aided in part by holiday incentives to close out the month. It’s important to note that improved volumes have been supported by supply improvements, pushing days of supply of inventory to 51 in April, up m/m from 48.
And while sales have moved higher vs. supply-constrained levels seen in years prior, the high cost of acquisition remains a challenge, keeping totals below the pre-pandemic average of roughly 17 million annual units.
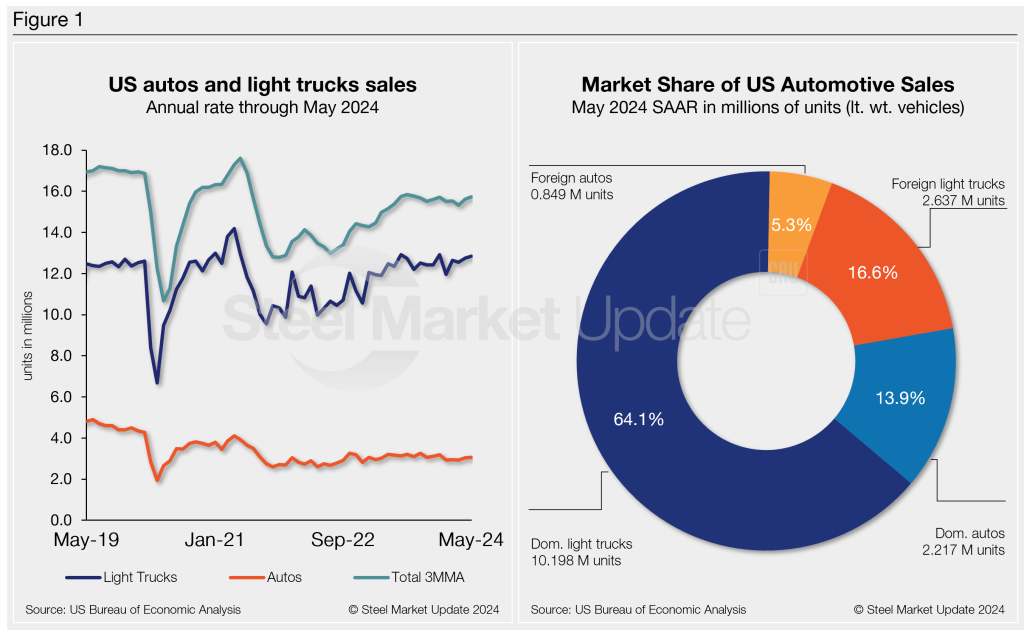
The average daily selling rate (DSR) was 54,963 – calculated over 26 days – up from May 2023’s 54,553 daily rate. Passenger vehicle sales slipped 1.1% y/y, while sales of light trucks moved higher by 6.3% over the same period. Light trucks accounted for 80% of last month’s sales, slightly above its 76% share of sales one year ago.
Below in Figure 1 is the long-term picture of sales of autos and lightweight trucks in the U.S. from 2019 through May 2024. Additionally, it includes the market share sales breakdown of last month’s 15.9 million vehicles at a seasonally adjusted annual rate.
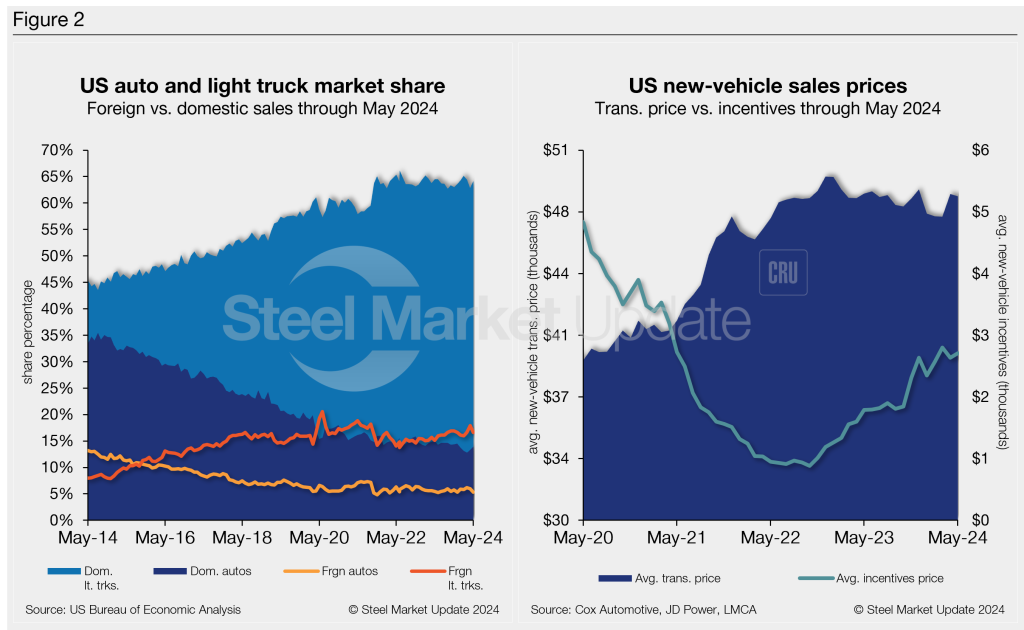
The new-vehicle ATP was $48,389 in May, down 0.2% from April. Last month’s ATP was just 0.3% (-$139) below the year-ago period, according to Cox Automotive data.
Incentives ticked back up last month after declining in April. Since hitting a 35-month high of $2,800 in March, incentives have fluctuated. In May incentives rose 2.9% to $2,710 vs. the prior month. With the m/m increase, incentives are roughly 5.6% of the average transaction price. Incentives are up about 52%, or $922, y/y.
In May, the annualized selling rate of light trucks was 12,835 million units, up 0.7% vs. the prior month and 3.9% better y/y. Annualized auto selling rates saw similar dynamics, up 0.9% m/m but down 3.2% y/y.
Figure 2 details the U.S. auto and light-truck market share since 2014 and the divergence between average transaction prices and incentives in the U.S. market since 2020.
Editor’s Note: This report is based on data from the U.S. Bureau of Economic Analysis (BEA), LMC Automotive, JD Power, and Cox Automotive for automotive sales in the U.S., Canada, and Mexico. Specifically, the report describes light-vehicle sales in the U.S.
This story first appeared at Steel Market Update.